
Bienvenue à L'Isle-d'Espagnac, ville du département de la Charente en région Nouvelle-Aquitaine. Comptabilisant aujourd'hui 5 682 habitants, la ville évolue en s'adaptant aux réalités de son territoire et aux besoins de sa population sous la gestion de son maire Michel ISSARD.
Présentation

Statistiques sur la population
Quel est le profil de la population, sa situation démographique ?
| Nombre d'habitants | 5 682 | Classement |
|---|---|---|
| Age moyen | 46 ans | Classement |
| Pop active | 42.9% | Classement |
| Taux chômage | 8% | Classement |
| Pop densité | 947 h/km² | Classement |
| Revenu moyen | 22 380 €/an | Classement |
Evolution du nombre d'habitants
Aujourd'hui, en 2026, la population de L'Isle-d'Espagnac est estimée à 5 786 habitants selon un modèle de régression linéaire appliqué aux dix dernières années. (5 762 en 2025).
Les derniers chiffres officiels publiés par la source INSEE en 2026 portent sur la population de 2023 qui enregistre une baisse de 0.2% sur un an.
Les derniers chiffres officiels publiés par la source INSEE en 2026 portent sur la population de 2023 qui enregistre une baisse de 0.2% sur un an.
Tranche d'âge


0-14 ans
15%

15-29 ans
15%

30-44 ans
15%

45-59 ans
19%

60-74 ans
18%

75-89 ans
13%

90 ans et +
4%
Activité professionnelle


Agriculteurs
0%

Artisans, Commerçants
3%

Cadres et sup.
5%

Professions intermédiaires
10%

Employé
15%

Ouvrier
10%

Retraité
30%

Autres
11%
Niveau de diplôme


Sans diplôme ou CEP
22%

Brevet, BEPC, DNB
5%

CAP-BEP ou équivalent
28%

BAC ou équivalent
19%

BAC+2
10%

BAC+3 ou +4
8%

BAC+5 ou plus
8%
Composition des ménages


Couple sans enfant
35%

Couple avec enfant(s)
27%

Famille monoparentale
8%

Colocation / Autre
3%

Personnes seules
27%
Profils électoraux
Quels sont les résultats des dernières élections aux présidentiels 2022 ?
Premier tour
 Emmanuel MACRON
29.87 %
 Jean-Luc MÉLENCHON
21.85 %
 Marine LE PEN
21.51 %
 Éric ZEMMOUR
5.86 %
 Yannick JADOT
4.74 %
 Valérie PÉCRESSE
4.40 %
 Jean LASSALLE
3.78 %
 Fabien ROUSSEL
2.52 %
 Anne HIDALGO
1.98 %
 Nicolas DUPONT-AIGNAN
1.84 %
 Philippe POUTOU
0.89 %
 Nathalie ARTHAUD
0.75 %
3 829 inscrits
Participation : 77.98%
Votes blancs : 1.24%
Votes nuls : 0.54%
Participation : 77.98%
Votes blancs : 1.24%
Votes nuls : 0.54%
Second tour
Emmanuel MACRON61,08 %
Marine LE PEN38,92 %
3 832 inscrits
Participation : 75.39%
Votes blancs : 7.41%
Votes nuls : 2.77%
Participation : 75.39%
Votes blancs : 7.41%
Votes nuls : 2.77%
Bon à savoir :
- Le revenu moyen par habitant à L'Isle-d'Espagnac (22 380 €) est au dessus de la moyenne nationale (20 590 €).
- La part de la population au chômage (8%) est inférieure à la moyenne nationale (8%).
- Le taux de chômage indiqué est au sens du BIT qui se distingue du taux de chômage au sens du recensement de la population.
Sources : Institut national de la statistique et des études économiques (insee) selon Les dernières parutions officielles de 2025 portant sur les années 2020, 2021 et 2022.
Sécurité, faits divers : les chiffres de la délinquance
| Agressions physiques / sexuelles | 43 |
|---|---|
| Cambriolages | 19 |
| Vols / dégradations | 116 |
| Stupéfiants | 14 |
Evolution du nombre d'infractions
Pour comparer(en proportion du nombre d'habitants)
La ville
Bilan sécurité 2025 : la ville de L'Isle-d'Espagnac est-elle sûre ?
L'examen des indices de criminalité à L'Isle-d'Espagnac pour l'année 2025 révèle une situation contrastée. Le bilan est divisé entre des indicateurs de proximité préservés et des points noirs localisés.
- Atteintes à l'intégrité physique : Concernant les atteintes à l'intégrité physique, la ville affiche un bilan positif avec un taux d'agressions et de violences volontaires nettement inférieur aux seuils nationaux.
- Cambriolages : La ville fait face à une pression sur les cambriolages. Le nombre d'effractions de logements dépasse les indicateurs de référence, nécessitant une vigilance accrue des habitants.
- Vols et dégradations : Le volume des vols et dégradations est conforme aux indicateurs nationaux. Les actes d'incivilités et les vols sans violence suivent la courbe moyenne du pays.
- Stupéfiants : La lutte contre les stupéfiants présente des résultats probants : l'activité liée au trafic et à l'usage est quasi absente des registres officiels de la commune.
Sources : Bases statistiques communale, départementale et régionale de la délinquance enregistrée par la police et la gendarmerie nationales selon les dernières parutions officielles de 2026 portant sur l'année 2025 (data.gouv).
Agressions physiques / sexuelles : Violences sexuelles, coups et blessures volontaires intrafamiliaux, coups et blessures volontaires, autres coups, blessures volontaires et vols violents sans arme.
Cambriolages : Cambriolages de logements.
Vols : Vols avec armes, vols d'accessoires sur véhicules, vols dans les véhicules, vols de véhicules, vols sans violence contre des personnes, destructions, dégradations volontaires et escroqueries.
Stupéfiants : Trafic de stupéfiants dont (AFD) et usage de stupéfiants.
Services à la population
Commerce |
|
|---|---|
|
Hypermarché Champniers 2km |
|
|
Supermarché Gond-Pontouvre 2km |
|
| Supérette | 3 |
| Boulangerie | 4 |
| Boucherie | 1 |
| Restaurant | 4 |
| Garage | 8 |
| Station-service | 1 |
| Banque | 3 |
| La poste | 8 |
| Coiffeur | 8 |
| Tabac | 1 |
| Bars / discothèque | 1 |
|
Bibliothèque Soyaux 2km |
|
|
Cinéma Angoulême 3km |
|
| Vétérinaire | 3 |
Santé |
|
|---|---|
| Pharmacie | 2 |
|
Hôpital Angoulême 4km |
|
|
Laboratoire d'analyses médicales Soyaux 3km |
|
| Etablissement pour handicapé | 1 |
| EHPA | 3 |
| Médecin | 3 |
|
Dentiste Ruelle-sur-Touvre 1km |
|
|
Chirurgien Soyaux 3km |
|
|
Dermatologue Soyaux 3km |
|
|
Anesthésiste Soyaux 3km |
|
|
Gastro-entérologue Soyaux 3km |
|
|
Gynécologue Angoulême 3km |
|
|
Cancérologue Périgueux 67km |
|
|
Neurologue Saint-Michel 7km |
|
|
Ophtalmologue Soyaux 3km |
|
|
ORL Angoulême 4km |
|
|
Cardiologue Ruelle-sur-Touvre 3km |
|
|
Pédiatre Soyaux 3km |
|
|
Pneumologue Soyaux 3km |
|
|
Psychologue Angoulême 3km |
|
|
Radiologue Soyaux 3km |
|
|
Rhumatologue Montignac-Charente 14km |
|
|
Sage-femme Ruelle-sur-Touvre 3km |
|
Bon à savoir :
- La ville ne possède pas de grands magasins alimentaire.
- La ville compte 1 médecin pour 1894 habitants.
- La ville ne dispose pas d'établissement scolaire public de seconde degré (collège et lycée) mais bénéficie de 1 école maternelle et 2 écoles primaires public.
Sources : Base Sirene des entreprises et de leurs établissements selon les dernières parutions officielles de 2025 portant sur l'année 2024 (data.gouv). Liste, localisation et tarifs des professionnels de santé selon les dernières parutions officielles de 2025 portant sur l'année 2024 (opendatasoft) et FINESS Extraction du Fichier des établissements selon les dernières parutions officielles de 2025 portant sur l'année 2024 (data.gouv). Adresse et géolocalisation des établissements d'enseignement du premier et second degrés selon les dernières parutions officielles de 2025 portant sur l'année 2024 (data.education.gouv)
Carte et superficie
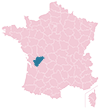
Carte de la ville de L'Isle-d'Espagnac
Bon à savoir :
- L'Isle-d'Espagnac est rattachée aux collectivités territoriales de la région Nouvelle-Aquitaine, du département Charente
- Le code postal de L'Isle-d'Espagnac est 16340.
- L'Isle-d'Espagnac s'étend sur une superficie de 6 km². Classement
- Les villes voisines les plus proches sont Soyaux, Magnac-sur-Touvre, Gond-Pontouvre, Ruelle-sur-Touvre et Touvre

Mairie de L'Isle-d'Espagnac
M. Michel ISSARD
Maire de L'Isle-d'Espagnac
Maire de L'Isle-d'Espagnac
Adresse
Place François-Mitterrand BP 615 16340 L'Isle-d'EspagnacContact
Heures d'ouvertures
Lundi : 09:00-12:30 13:30-17:00Mardi : 09:00-12:30 13:30-17:00
Mercredi : 09:00-12:30 13:30-17:00
Jeudi : 09:00-12:30 13:30-17:00
Vendredi : 09:00-12:30 13:30-17:00
Samedi : Fermé
Dimanche : Fermé
Photos de L'Isle-d'Espagnac

Villes autour de L'Isle-d'Espagnac
| Ville | Habitants | Superficie | Pop densité | Pop active | Taux chômage | Revenu moyen | Prix immobilier | Note globale |
|---|---|---|---|---|---|---|---|---|
| Statistiques Soyaux | 10 087 | 12 km² | 841 h/km² | 38.6% | 8.8% | 18 730 €/an | 1 355 €/m² | 2.9 |
| Statistiques Magnac-sur-Touvre | 3 255 | 7 km² | 465 h/km² | 45.9% | 4.4% | 24 270 €/an | 1 418 €/m² | - |
| Statistiques Gond-Pontouvre | 5 862 | 7 km² | 837 h/km² | 48.3% | 5.3% | 21 880 €/an | 1 344 €/m² | 2.9 |
| Statistiques Ruelle-sur-Touvre | 7 408 | 10 km² | 741 h/km² | 43.7% | 5.3% | 22 460 €/an | 1 300 €/m² | 3.7 |
| Statistiques Touvre | 1 150 | 9 km² | 128 h/km² | 46% | 3.8% | 24 930 €/an | 1 512 €/m² | - |
| Statistiques Angoulême | 41 908 | 21 km² | 1 996 h/km² | 46.2% | 9.1% | 19 830 €/an | 1 433 €/m² | 3.2 |
| Statistiques Mornac | 2 107 | 23 km² | 92 h/km² | 47.1% | 4.7% | 24 990 €/an | 1 330 €/m² | 4.4 |
| Statistiques Champniers | 5 281 | 45 km² | 117 h/km² | 46.3% | 2.9% | 25 410 €/an | 1 513 €/m² | 3.5 |
| Statistiques Puymoyen | 2 403 | 7 km² | 343 h/km² | 38.9% | 2.7% | 27 640 €/an | 1 667 €/m² | 3.0 |
| Statistiques Garat | 2 105 | 19 km² | 111 h/km² | 47.7% | 3.2% | 25 570 €/an | 1 503 €/m² | 3.2 |
| Statistiques Saint-Yrieix-sur-Charente | 7 539 | 14 km² | 539 h/km² | 44.5% | 5% | 24 140 €/an | 1 573 €/m² | - |
| Statistiques Balzac | 1 410 | 9 km² | 157 h/km² | 45.2% | 3.8% | 25 860 €/an | 1 542 €/m² | 3.4 |
| Statistiques Fléac | 3 861 | 12 km² | 322 h/km² | 46.3% | 4.6% | 23 980 €/an | 1 456 €/m² | 4.3 |
| Statistiques Saint-Michel | 3 196 | 2 km² | 1 598 h/km² | 42.8% | 6.1% | 21 170 €/an | 1 269 €/m² | - |
| Statistiques Dirac | 1 516 | 29 km² | 52 h/km² | 44.1% | 3.5% | 24 710 €/an | 1 800 €/m² | 3.8 |
Articles en relation
Acteur de l'économie locale :Faites découvrir vos services à L'Isle-d'Espagnac
Signalement de photo
Merci ! Votre signalement est envoyé !
Ajouter une photo de L'Isle-d'Espagnac
Merci ! Votre photo sera diffusée sur le site après modération.