
Bienvenue à Buzançais, ville du département de l'Indre en région Centre-Val de Loire. Comptabilisant aujourd'hui 4 356 habitants, la ville évolue en s'adaptant aux réalités de son territoire et aux besoins de sa population sous la gestion de son maire Nicolas THOMAS.
Présentation

Statistiques sur la population
Quel est le profil de la population, sa situation démographique ?
| Nombre d'habitants | 4 356 | Classement |
|---|---|---|
| Age moyen | 47 ans | Classement |
| Pop active | 42.1% | Classement |
| Taux chômage | 10.1% | Classement |
| Pop densité | 75 h/km² | Classement |
| Revenu moyen | 20 680 €/an | Classement |
Evolution du nombre d'habitants
Aujourd'hui, en 2026, la population de Buzançais est estimée à 4 421 habitants selon un modèle de régression linéaire appliqué aux dix dernières années. (4 429 en 2025).
Les derniers chiffres officiels publiés par la source INSEE en 2026 portent sur la population de 2023 qui enregistre une baisse de 1.7% sur un an.
Les derniers chiffres officiels publiés par la source INSEE en 2026 portent sur la population de 2023 qui enregistre une baisse de 1.7% sur un an.
Tranche d'âge


0-14 ans
16%

15-29 ans
13%

30-44 ans
15%

45-59 ans
21%

60-74 ans
20%

75-89 ans
15%

90 ans et +
2%
Activité professionnelle


Agriculteurs
1%

Artisans, Commerçants
2%

Cadres et sup.
3%

Professions intermédiaires
9%

Employé
15%

Ouvrier
13%

Retraité
34%

Autres
11%
Niveau de diplôme


Sans diplôme ou CEP
33%

Brevet, BEPC, DNB
8%

CAP-BEP ou équivalent
32%

BAC ou équivalent
14%

BAC+2
7%

BAC+3 ou +4
4%

BAC+5 ou plus
3%
Composition des ménages


Couple sans enfant
41%

Couple avec enfant(s)
27%

Famille monoparentale
5%

Colocation / Autre
1%

Personnes seules
26%
Profils électoraux
Quels sont les résultats des dernières élections aux présidentiels 2022 ?
Premier tour
 Marine LE PEN
36.48 %
 Emmanuel MACRON
24.79 %
 Jean-Luc MÉLENCHON
13.62 %
 Valérie PÉCRESSE
5.20 %
 Éric ZEMMOUR
4.84 %
 Jean LASSALLE
3.39 %
 Fabien ROUSSEL
3.06 %
 Nicolas DUPONT-AIGNAN
2.82 %
 Yannick JADOT
2.26 %
 Anne HIDALGO
1.73 %
 Nathalie ARTHAUD
1.17 %
 Philippe POUTOU
0.64 %
3 459 inscrits
Participation : 74.44%
Votes blancs : 2.45%
Votes nuls : 1.20%
Participation : 74.44%
Votes blancs : 2.45%
Votes nuls : 1.20%
Second tour
Emmanuel MACRON44,22 %
Marine LE PEN55,78 %
3 459 inscrits
Participation : 75.37%
Votes blancs : 5.75%
Votes nuls : 2.65%
Participation : 75.37%
Votes blancs : 5.75%
Votes nuls : 2.65%
Bon à savoir :
- Le revenu moyen par habitant à Buzançais (20 680 €) est au dessus de la moyenne nationale (20 590 €).
- La part de la population au chômage (10.1%) est supérieure à la moyenne nationale (8%).
- Le taux de chômage indiqué est au sens du BIT qui se distingue du taux de chômage au sens du recensement de la population.
Sources : Institut national de la statistique et des études économiques (insee) selon Les dernières parutions officielles de 2025 portant sur les années 2020, 2021 et 2022.
Sécurité, faits divers : les chiffres de la délinquance
| Agressions physiques / sexuelles | 30 |
|---|---|
| Cambriolages | 22 |
| Vols / dégradations | 86 |
| Stupéfiants | 0 |
Evolution du nombre d'infractions
Pour comparer(en proportion du nombre d'habitants)
La ville
Bilan sécurité 2025 : la ville de Buzançais est-elle sûre ?
L'examen des indices de criminalité à Buzançais pour l'année 2025 révèle une situation favorable. Le climat sécuritaire y est serein, avec des indicateurs de délinquance majoritairement inférieurs aux moyennes nationales.
- Atteintes à l'intégrité physique : Concernant les atteintes à l'intégrité physique, la ville affiche un bilan positif avec un taux d'agressions et de violences volontaires nettement inférieur aux seuils nationaux.
- Cambriolages : La ville fait face à une pression sur les cambriolages. Le nombre d'effractions de logements dépasse les indicateurs de référence, nécessitant une vigilance accrue des habitants.
- Vols et dégradations : La délinquance de proximité, incluant les vols et le vandalisme, est contenue. Les chiffres montrent une commune relativement épargnée par les dégradations urbaines.
- Stupéfiants : La lutte contre les stupéfiants présente des résultats probants : l'activité liée au trafic et à l'usage est quasi absente des registres officiels de la commune.
Sources : Bases statistiques communale, départementale et régionale de la délinquance enregistrée par la police et la gendarmerie nationales selon les dernières parutions officielles de 2026 portant sur l'année 2025 (data.gouv).
Agressions physiques / sexuelles : Violences sexuelles, coups et blessures volontaires intrafamiliaux, coups et blessures volontaires, autres coups, blessures volontaires et vols violents sans arme.
Cambriolages : Cambriolages de logements.
Vols : Vols avec armes, vols d'accessoires sur véhicules, vols dans les véhicules, vols de véhicules, vols sans violence contre des personnes, destructions, dégradations volontaires et escroqueries.
Stupéfiants : Trafic de stupéfiants dont (AFD) et usage de stupéfiants.
Services à la population
Commerce |
|
|---|---|
| Hypermarché | 1 |
| Supermarché | 1 |
| Supérette | 1 |
| Boulangerie | 4 |
| Boucherie | 2 |
| Restaurant | 4 |
| Garage | 6 |
| Station-service | 3 |
| Banque | 4 |
| La poste | 1 |
| Coiffeur | 12 |
|
Tabac Villedieu-sur-Indre 10km |
|
| Bars / discothèque | 4 |
|
Bibliothèque Mézières-en-Brenne 17km |
|
|
Cinéma Saint-Lactencin 6km |
|
| Vétérinaire | 2 |
Santé |
|
|---|---|
| Pharmacie | 1 |
|
Hôpital Châteauroux 22km |
|
| Laboratoire d'analyses médicales | 1 |
| Etablissement pour handicapé | 1 |
| EHPA | 1 |
| Médecin | 2 |
|
Dentiste Niherne 13km |
|
|
Chirurgien Châteauroux 23km |
|
|
Dermatologue Le Blanc 39km |
|
|
Anesthésiste Saint-Flovier 31km |
|
|
Gastro-entérologue Saint-Aignan 42km |
|
|
Gynécologue Châteauroux 23km |
|
|
Cancérologue Chambray-lès-Tours 74km |
|
|
Neurologue Châteauroux 23km |
|
|
Ophtalmologue Châteauroux 23km |
|
|
ORL Châteauroux 22km |
|
|
Cardiologue Châteauroux 22km |
|
|
Pédiatre Châtellerault 67km |
|
|
Pneumologue Châteauroux 23km |
|
|
Psychologue Châteauroux 23km |
|
|
Radiologue Châteauroux 23km |
|
|
Rhumatologue Déols 22km |
|
| Sage-femme | 1 |
Éducation |
|
|---|---|
| Crèche | 1 |
| Ecole maternelle Public | 1 |
|
Ecole maternelle Privé Céré-la-Ronde 45km |
|
| Ecole primaire Public | 1 |
| Ecole primaire Privé | 1 |
| Collège Public | 1 |
| Collège Privé | 1 |
|
Lycée Public Châteauroux 22km |
|
|
Lycée Privé Châteauroux 23km |
|
Bon à savoir :
- La ville comptabilise de nombreux commerces divers et variés.
- La ville compte 1 médecin pour 2178 habitants.
- La ville dispose de plusieurs établissements scolaire public mais pas de lycée.
Sources : Base Sirene des entreprises et de leurs établissements selon les dernières parutions officielles de 2025 portant sur l'année 2024 (data.gouv). Liste, localisation et tarifs des professionnels de santé selon les dernières parutions officielles de 2025 portant sur l'année 2024 (opendatasoft) et FINESS Extraction du Fichier des établissements selon les dernières parutions officielles de 2025 portant sur l'année 2024 (data.gouv). Adresse et géolocalisation des établissements d'enseignement du premier et second degrés selon les dernières parutions officielles de 2025 portant sur l'année 2024 (data.education.gouv)
Carte et superficie
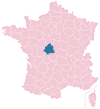
Carte de la ville de Buzançais
Bon à savoir :
- Buzançais est rattachée aux collectivités territoriales de la région Centre-Val de Loire, du département Indre
- Le code postal de Buzançais est 36500.
- Buzançais s'étend sur une superficie de 58 km². Classement
- Les villes voisines les plus proches sont Saint-Lactencin, Argy, La Chapelle-Orthemale, Sainte-Gemme et Saint-Genou

Mairie de Buzançais
M. Nicolas THOMAS
Maire de Buzançais
Maire de Buzançais
Adresse
10 avenue de la République 36500 BuzançaisContact
Heures d'ouvertures
Lundi : 14:30-17:30Mardi : 09:00-12:00 14:30-17:30
Mercredi : 09:00-12:00 14:30-17:30
Jeudi : 09:00-12:00 14:30-17:30
Vendredi : 09:00-12:00 14:30-17:30
Samedi : 09:00-12:00
Dimanche : Fermé
Photos de Buzançais

Villes autour de Buzançais
| Ville | Habitants | Superficie | Pop densité | Pop active | Taux chômage | Revenu moyen | Prix immobilier | Note globale |
|---|---|---|---|---|---|---|---|---|
| Statistiques Saint-Lactencin | 405 | 32 km² | 13 h/km² | 48.1% | 4.4% | 21 750 €/an | 1 846 €/m² | - |
| Statistiques Argy | 559 | 38 km² | 15 h/km² | 47.9% | 2.9% | 21 300 €/an | 1 065 €/m² | - |
| Statistiques La Chapelle-Orthemale | 100 | 16 km² | 6 h/km² | 47% | 2% | NC | 999 €/m² | - |
| Statistiques Sainte-Gemme | 262 | 32 km² | 8 h/km² | 37.8% | 6.5% | 21 570 €/an | 1 406 €/m² | - |
| Statistiques Saint-Genou | 911 | 24 km² | 38 h/km² | 42.9% | 5.2% | 20 550 €/an | 952 €/m² | - |
| Statistiques Sougé | 140 | 13 km² | 11 h/km² | 52.9% | 6.4% | 20 830 €/an | 888 €/m² | - |
| Statistiques Villedieu-sur-Indre | 2 583 | 57 km² | 45 h/km² | 49.2% | 3.7% | 21 650 €/an | 1 025 €/m² | 2.3 |
| Statistiques Villegouin | 325 | 24 km² | 14 h/km² | 40.6% | 2.8% | 20 570 €/an | 984 €/m² | - |
| Statistiques Vendoeuvres | 1 086 | 96 km² | 11 h/km² | 46.8% | 4.1% | 21 780 €/an | 954 €/m² | - |
| Statistiques Palluau-sur-Indre | 785 | 41 km² | 19 h/km² | 38.3% | 3.6% | 20 770 €/an | 1 039 €/m² | 3.4 |
| Statistiques Pellevoisin | 792 | 25 km² | 32 h/km² | 33% | 5.2% | 20 130 €/an | 538 €/m² | - |
| Statistiques Chezelles | 452 | 17 km² | 27 h/km² | 52% | 2.7% | 22 320 €/an | 970 €/m² | - |
| Statistiques Arpheuilles | 240 | 22 km² | 11 h/km² | 40.8% | 5.4% | 18 420 €/an | 488 €/m² | - |
| Statistiques Saulnay | 164 | 22 km² | 7 h/km² | 36% | 3.7% | 20 070 €/an | 955 €/m² | - |
| Statistiques Niherne | 1 444 | 42 km² | 34 h/km² | 48.8% | 3.1% | 23 350 €/an | 1 157 €/m² | - |
Articles en relation
Acteur de l'économie locale :Faites découvrir vos services à Buzançais
Signalement de photo
Merci ! Votre signalement est envoyé !
Ajouter une photo de Buzançais
Merci ! Votre photo sera diffusée sur le site après modération.