
Bienvenue à Trignac, ville du département de la Loire-Atlantique en région Pays de la Loire. Comptabilisant aujourd'hui 8 397 habitants, la ville évolue en s'adaptant aux réalités de son territoire et aux besoins de sa population sous la gestion de son maire Claude AUFORT.
Présentation
Statistiques sur la population
Quel est le profil de la population, sa situation démographique ?
| Nombre d'habitants | 8 397 | Classement |
|---|---|---|
| Age moyen | 41 ans | Classement |
| Pop active | 45.2% | Classement |
| Taux chômage | 9% | Classement |
| Pop densité | 600 h/km² | Classement |
| Revenu moyen | 21 210 €/an | Classement |
Evolution du nombre d'habitants
Aujourd'hui, en 2026, la population de Trignac est estimée à 8 625 habitants selon un modèle de régression linéaire appliqué aux dix dernières années. (8 536 en 2025).
Les derniers chiffres officiels publiés par la source INSEE en 2026 portent sur la population de 2023 qui enregistre une hausse de 1.9% sur un an.
Les derniers chiffres officiels publiés par la source INSEE en 2026 portent sur la population de 2023 qui enregistre une hausse de 1.9% sur un an.
Tranche d'âge


0-14 ans
18%

15-29 ans
16%

30-44 ans
18%

45-59 ans
19%

60-74 ans
17%

75-89 ans
7%

90 ans et +
1%
Activité professionnelle


Agriculteurs
0%

Artisans, Commerçants
2%

Cadres et sup.
2%

Professions intermédiaires
12%

Employé
14%

Ouvrier
15%

Retraité
22%

Autres
12%
Niveau de diplôme


Sans diplôme ou CEP
21%

Brevet, BEPC, DNB
4%

CAP-BEP ou équivalent
41%

BAC ou équivalent
17%

BAC+2
10%

BAC+3 ou +4
5%

BAC+5 ou plus
2%
Composition des ménages


Couple sans enfant
35%

Couple avec enfant(s)
35%

Famille monoparentale
6%

Colocation / Autre
3%

Personnes seules
21%
Profils électoraux
Quels sont les résultats des dernières élections aux présidentiels 2022 ?
Premier tour
 Marine LE PEN
29.11 %
 Emmanuel MACRON
25.51 %
 Jean-Luc MÉLENCHON
22.54 %
 Fabien ROUSSEL
4.43 %
 Éric ZEMMOUR
3.99 %
 Yannick JADOT
3.59 %
 Jean LASSALLE
2.63 %
 Anne HIDALGO
2.43 %
 Valérie PÉCRESSE
2.11 %
 Nicolas DUPONT-AIGNAN
1.81 %
 Philippe POUTOU
0.94 %
 Nathalie ARTHAUD
0.92 %
5 757 inscrits
Participation : 71.88%
Votes blancs : 1.84%
Votes nuls : 0.60%
Participation : 71.88%
Votes blancs : 1.84%
Votes nuls : 0.60%
Second tour
Emmanuel MACRON51,79 %
Marine LE PEN48,21 %
5 765 inscrits
Participation : 72.12%
Votes blancs : 8.35%
Votes nuls : 2.36%
Participation : 72.12%
Votes blancs : 8.35%
Votes nuls : 2.36%
Bon à savoir :
- Le revenu moyen par habitant à Trignac (21 210 €) est au dessus de la moyenne nationale (20 590 €).
- La part de la population au chômage (9%) est supérieure à la moyenne nationale (8%).
- Le taux de chômage indiqué est au sens du BIT qui se distingue du taux de chômage au sens du recensement de la population.
Sources : Institut national de la statistique et des études économiques (insee) selon Les dernières parutions officielles de 2025 portant sur les années 2020, 2021 et 2022.
Insécurité, faits divers : les chiffres de la délinquance
| Agressions physiques / sexuelles | 96 | Classement |
|---|---|---|
| Cambriolages | 24 | Classement |
| Vols / dégradations | 367 | Classement |
| Stupéfiants | 68 | Classement |
Evolution du nombre d'infractions
Pour comparer(en proportion du nombre d'habitants)
La ville
Bilan sécurité 2026 : la ville de Trignac est-elle sûre ?
L'examen récent des indices de criminalité à Trignac révèle une situation dégradée. On observe une pression délinquante réelle : plusieurs indicateurs clés de la sécurité publique sont en zone de vigilance.
- Atteintes à l'intégrité physique : Sur le front des agressions physiques et sexuelles, Trignac se situe dans la moyenne des villes françaises, sans décrochage notable par rapport aux statistiques de référence. 96 faits recensés en 2025, en baisse de 15 % sur un an.
- Cambriolages : La ville fait face à une pression sur les cambriolages. Le nombre d'effractions de logements dépasse les indicateurs de référence, nécessitant une vigilance accrue des habitants. 24 effractions constatées en 2025, en diminution de 11.1 % sur un an.
- Vols et dégradations : On note une récurrence des faits de petite délinquance. Les indicateurs de vols et destructions volontaires sont supérieurs à la moyenne, pesant sur le sentiment de sécurité. 367 infractions enregistrées en 2025, en augmentation de 24.4 % sur un an.
- Stupéfiants : La thématique des stupéfiants marque un point de tension : les faits de trafic ou d'usage recensés sont supérieurs aux seuils de référence nationaux. 68 signalements en 2025, marquant une atténuation de 26.9 % sur un an.
Sources : Bases statistiques communale, départementale et régionale de la délinquance enregistrée par la police et la gendarmerie nationales selon les dernières parutions officielles de 2026 portant sur l'année 2025 (data.gouv).
Agressions physiques / sexuelles : Violences sexuelles, coups et blessures volontaires intrafamiliaux, coups et blessures volontaires, autres coups, blessures volontaires et vols violents sans arme.
Cambriolages : Cambriolages de logements.
Vols : Vols avec armes, vols d'accessoires sur véhicules, vols dans les véhicules, vols de véhicules, vols sans violence contre des personnes, destructions, dégradations volontaires et escroqueries.
Stupéfiants : Trafic de stupéfiants dont (AFD) et usage de stupéfiants.
Services à la population
Commerce |
|
|---|---|
| Hypermarché | 1 |
| Supermarché | 4 |
| Supérette | 3 |
| Boulangerie | 3 |
|
Boucherie Saint-Nazaire 2km |
|
| Restaurant | 9 |
| Garage | 14 |
| Station-service | 3 |
| Banque | 7 |
| La poste | 18 |
| Coiffeur | 13 |
| Tabac | 1 |
| Bars / discothèque | 5 |
|
Bibliothèque Saint-Nazaire 5km |
|
|
Cinéma Saint-Malo-de-Guersac 4km |
|
|
Vétérinaire Montoir-de-Bretagne 2km |
|
Santé |
|
|---|---|
| Pharmacie | 2 |
|
Hôpital Saint-Nazaire 5km |
|
| Laboratoire d'analyses médicales | 1 |
| Etablissement pour handicapé | 1 |
| EHPA | 1 |
| Médecin | 5 |
| Dentiste | 1 |
|
Chirurgien Saint-Nazaire 8km |
|
|
Dermatologue Saint-Nazaire 6km |
|
|
Anesthésiste Saint-Nazaire 8km |
|
|
Gastro-entérologue Saint-Nazaire 2km |
|
|
Gynécologue Saint-Nazaire 8km |
|
|
Cancérologue Nantes 50km |
|
|
Neurologue Montoir-de-Bretagne 3km |
|
|
Ophtalmologue Saint-Nazaire 8km |
|
|
ORL Saint-Nazaire 5km |
|
|
Cardiologue Montoir-de-Bretagne 2km |
|
|
Pédiatre Saint-Nazaire 7km |
|
|
Pneumologue Saint-Nazaire 9km |
|
|
Psychologue Saint-Nazaire 5km |
|
|
Radiologue Montoir-de-Bretagne 2km |
|
|
Rhumatologue Saint-Nazaire 8km |
|
| Sage-femme | 1 |
Éducation |
|
|---|---|
| Crèche | 3 |
| Ecole maternelle Public | 3 |
|
Ecole maternelle Privé Prinquiau 14km |
|
| Ecole primaire Public | 2 |
|
Ecole primaire Privé Saint-Nazaire 2km |
|
| Collège Public | 1 |
|
Collège Privé Saint-Nazaire 5km |
|
|
Lycée Public Saint-Nazaire 4km |
|
|
Lycée Privé Montoir-de-Bretagne 2km |
|
Bon à savoir :
- La ville comptabilise de nombreux commerces divers et variés.
- La ville compte 1 médecin pour 1679 habitants.
- La ville dispose de plusieurs établissements scolaire public mais pas de lycée.
Sources : Base Sirene des entreprises et de leurs établissements selon les dernières parutions officielles de 2025 portant sur l'année 2024 (data.gouv). Liste, localisation et tarifs des professionnels de santé selon les dernières parutions officielles de 2025 portant sur l'année 2024 (opendatasoft) et FINESS Extraction du Fichier des établissements selon les dernières parutions officielles de 2025 portant sur l'année 2024 (data.gouv). Adresse et géolocalisation des établissements d'enseignement du premier et second degrés selon les dernières parutions officielles de 2025 portant sur l'année 2024 (data.education.gouv)
Carte et superficie
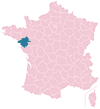
Carte de la ville de Trignac
Bon à savoir :
- Trignac est rattachée aux collectivités territoriales de la région Pays de la Loire, du département Loire-Atlantique
- Le code postal de Trignac est 44570.
- Trignac s'étend sur une superficie de 14 km². Classement
- Les villes voisines les plus proches sont Montoir-de-Bretagne, Saint-Malo-de-Guersac, Le Pin, Saint-Nazaire et Saint-Joachim

Toutes les cartes du 44
Mairie de Trignac
M. Claude AUFORT
Maire de Trignac
Maire de Trignac
Adresse
11 place de la Mairie 44570 TrignacContact
Heures d'ouvertures
Lundi : 08:30-12:00 13:30-17:00Mardi : 08:30-12:00 13:30-17:00
Mercredi : 08:30-12:00 13:30-17:00
Jeudi : 08:30-12:00 13:30-17:00
Vendredi : 08:30-12:00 13:30-17:00
Samedi : 09:00-12:00
Dimanche : Fermé
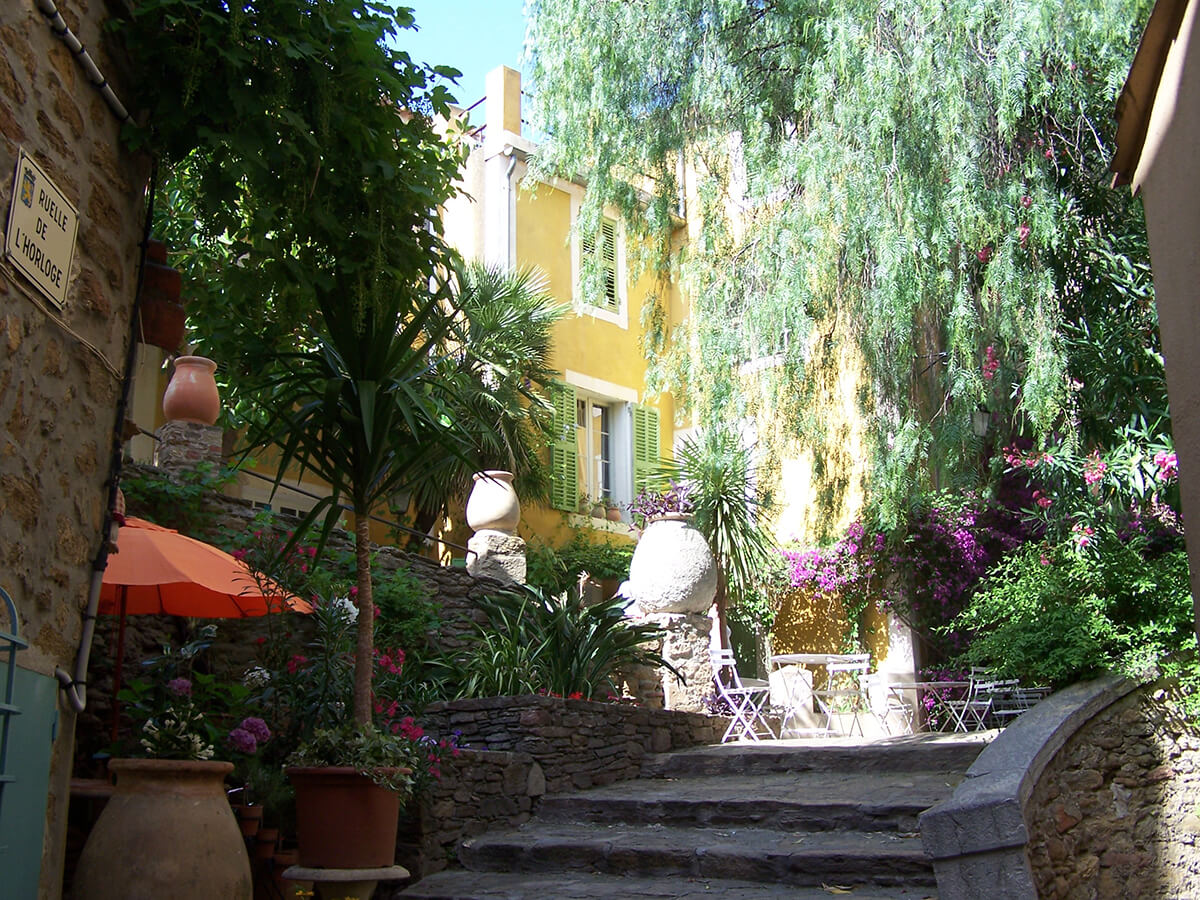
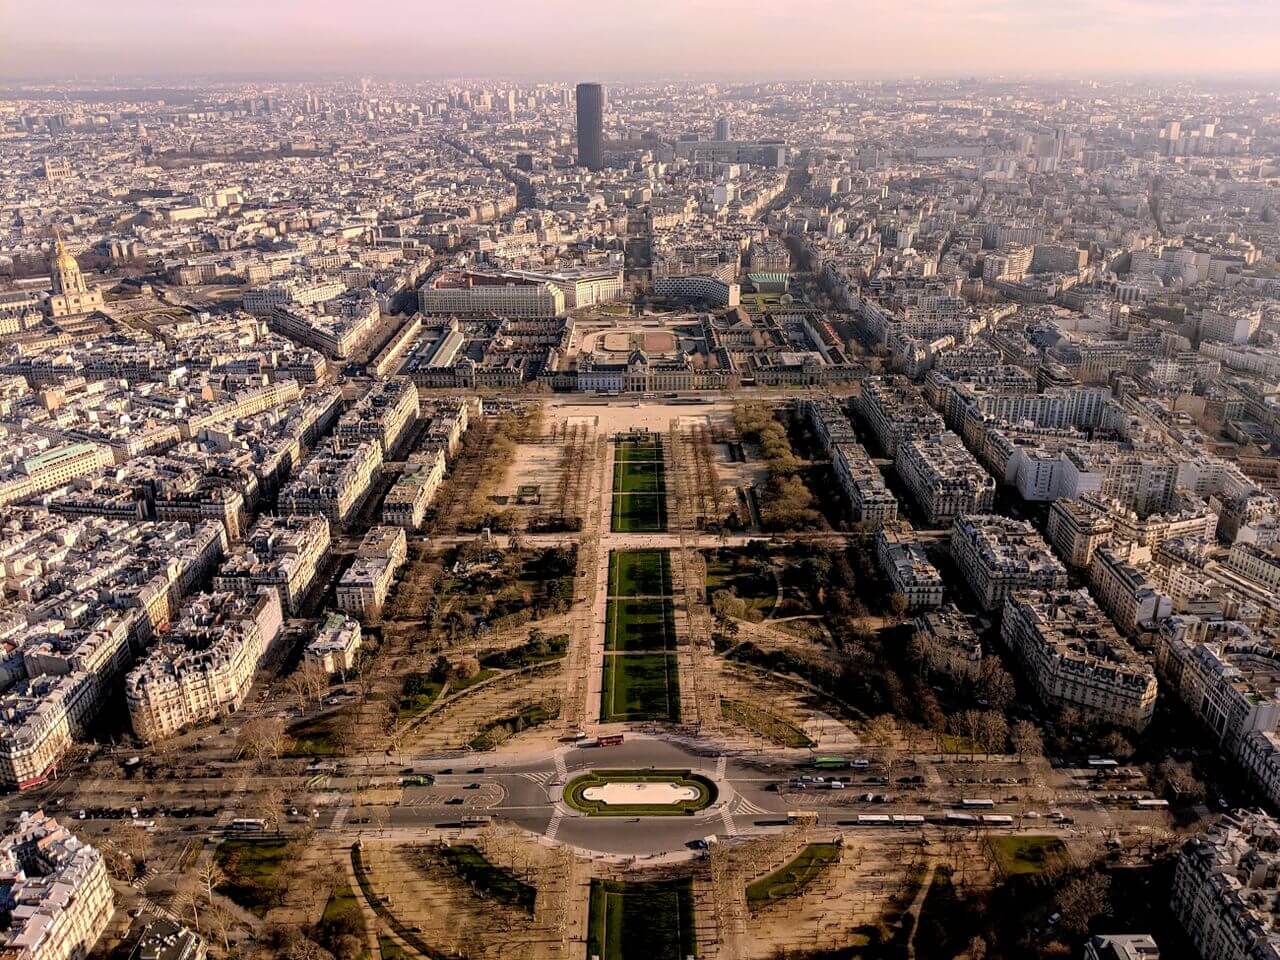
Photos de Trignac

Villes autour de Trignac
| Ville | Habitants | Superficie | Pop densité | Pop active | Taux chômage | Revenu moyen | Prix immobilier | Note globale |
|---|---|---|---|---|---|---|---|---|
| Statistiques Montoir-de-Bretagne | 7 282 | 36 km² | 202 h/km² | 47% | 4% | 22 090 €/an | 1 894 €/m² | 3.7 |
| Statistiques Saint-Malo-de-Guersac | 3 203 | 14 km² | 229 h/km² | 45.9% | 3.9% | 22 730 €/an | 1 863 €/m² | 4.3 |
| Statistiques Le Pin | 868 | 25 km² | 35 h/km² | 41.9% | 3.7% | 21 410 €/an | 1 113 €/m² | - |
| Statistiques Saint-Nazaire | 74 568 | 46 km² | 1 621 h/km² | 42% | 6.1% | 21 900 €/an | 2 329 €/m² | 3.0 |
| Statistiques Saint-Joachim | 4 112 | 86 km² | 48 h/km² | 46.2% | 4.4% | 22 060 €/an | 1 590 €/m² | 3.6 |
| Statistiques Saint-Brevin-les-Pins | 14 541 | 19 km² | 765 h/km² | 39.8% | 3.6% | 25 290 €/an | 3 136 €/m² | 3.6 |
| Statistiques Donges | 8 219 | 48 km² | 171 h/km² | 49.3% | 4% | 22 520 €/an | 1 769 €/m² | 4.0 |
| Statistiques Saint-André-des-Eaux | 7 013 | 24 km² | 292 h/km² | 48.4% | 2.9% | 26 240 €/an | 2 349 €/m² | 4.0 |
| Statistiques Corsept | 2 594 | 23 km² | 113 h/km² | 51% | 4.2% | 24 200 €/an | 2 208 €/m² | 3.6 |
| Statistiques Crossac | 2 974 | 25 km² | 119 h/km² | 50.1% | 2.7% | 23 370 €/an | 1 592 €/m² | 3.6 |
| Statistiques Paimboeuf | 3 045 | 2 km² | 1 523 h/km² | 43.3% | 5.2% | 20 790 €/an | 1 673 €/m² | 3.1 |
| Statistiques Besné | 3 322 | 17 km² | 195 h/km² | 51.1% | 3.9% | 24 040 €/an | 1 734 €/m² | 3.2 |
| Statistiques Saint-Lyphard | 5 304 | 24 km² | 221 h/km² | 46.3% | 2.8% | 24 360 €/an | 2 006 €/m² | 4.8 |
| Statistiques Sainte-Reine-de-Bretagne | 2 484 | 19 km² | 131 h/km² | 44.7% | 3.8% | 22 050 €/an | 1 515 €/m² | - |
| Statistiques La Baule-Escoublac | 16 912 | 22 km² | 769 h/km² | 33.8% | 4% | 28 490 €/an | 4 750 €/m² | 3.6 |
Articles en relation
Acteur de l'économie locale :Faites découvrir vos services à Trignac


Signalement de photo
Merci ! Votre signalement est envoyé !
Ajouter une photo de Trignac
Merci ! Votre photo sera diffusée sur le site après modération.