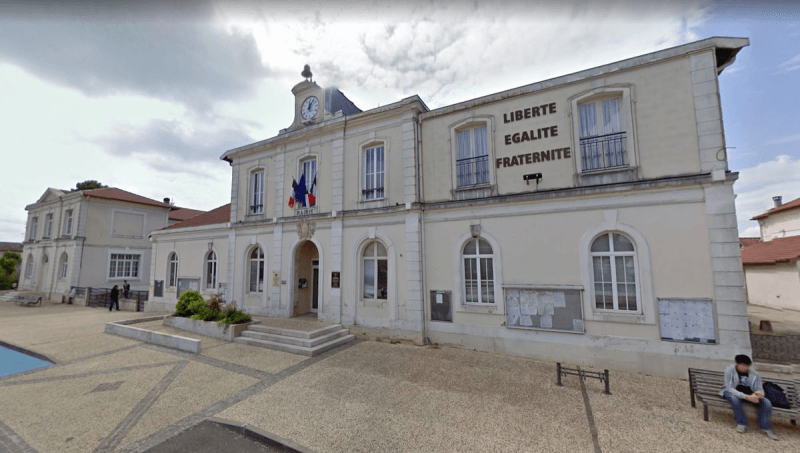
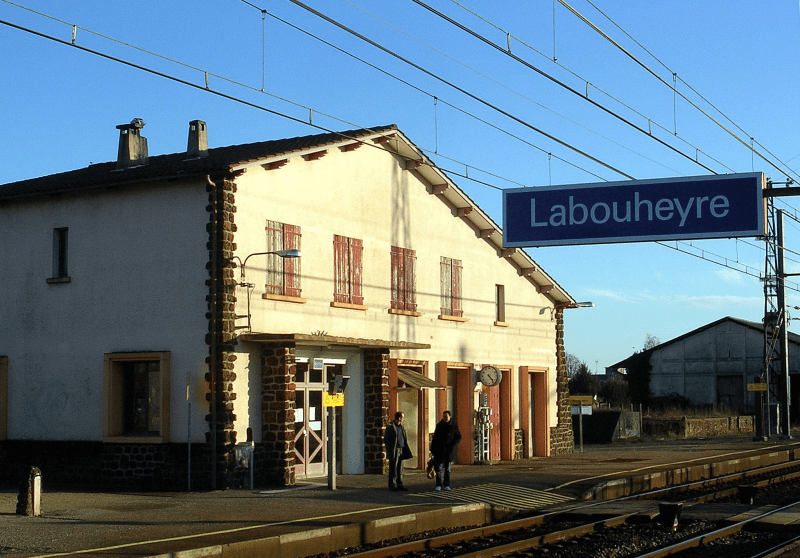
Bienvenue à Labouheyre, ville du département des Landes en région Nouvelle-Aquitaine. Comptabilisant aujourd'hui 2 906 habitants, la ville évolue en s'adaptant aux réalités de son territoire et aux besoins de sa population sous la gestion de son maire Didier PRESSARD.
Reconnue pour la valorisation de son patrimoine végétal et ses efforts d'embellissement, Labouheyre est labellisée Villes et Villages Fleuris avec la distinction de 2 fleurs.
Statistiques sur la population
Quel est le profil de la population, sa situation démographique ?
Aujourd'hui, en 2026, la population de Labouheyre est estimée à 2 945 habitants selon un modèle de régression linéaire appliqué aux dix dernières années. (2 923 en 2025).
Les derniers chiffres officiels publiés par la source INSEE en 2026 portent sur la population de 2023 qui enregistre une hausse de 0.8% sur un an.
Sources : Institut national de la statistique et des études économiques (insee) selon Les dernières parutions officielles de 2025 portant sur les années 2020, 2021 et 2022.
Insécurité, faits divers : les chiffres de la délinquance
8/10Note globalefavorableIndice de Tranquillité Bien-dans-ma-ville
L'Indice de Tranquillité de Bien-dans-ma-ville.fr a été conçu pour être le plus juste et transparent possible. Pour pouvoir comparer équitablement une petite commune et une grande métropole, nous ramenons d'abord tous les faits de délinquance à un taux pour 1 000 habitants.
La pondération des indicateurs selon leur gravité
Chaque catégorie de délinquance reçoit un coefficient multiplicateur selon son degré de gravité et son impact réel sur le quotidien des habitants :
Agressions (Atteintes physiques et sexuelles) : Coefficient 3 (Critère majeur, intégrité des personnes).
Cambriolages (Logements et commerces) : Coefficient 2 (Violation de l'intimité du domicile).
Vols et Dégradations (Petite délinquance) : Coefficient 1 (Incivilités et délinquance de proximité).
Stupéfiants (Trafic et usage) : Coefficient 1 (Indicateur lié aux réseaux et à la santé publique).
Les catégories d'infractions sont un regroupement des suivantes :
Agressions : Violences sexuelles, coups et blessures volontaires intrafamiliaux, coups et blessures volontaires, autres coups, blessures volontaires et vols violents sans arme.
Cambriolages : Cambriolages de logements.
Vols : Vols avec armes, vols d'accessoires sur véhicules, vols dans les véhicules, vols de véhicules, vols sans violence contre des personnes, destructions, dégradations volontaires et escroqueries.
Stupéfiants : Trafic de stupéfiants dont (AFD) et usage de stupéfiants.
Le calcul des notes par catégorie de délinquance
En posant la moyenne nationale à 5/10 (notre point de comparaison) et la note maximale à 10/10, nous appliquons la formule suivante : Note = 10 - 5 x (Valeur Ville / Valeur Référence Nationale)
Ainsi pour les cas de figure suivants nous obtenons :
Une ville sans aucun fait de délinquance obtient la note de 10/10. Note = 10 - 5 x 0 = 10
Une ville avec 2 fois moins de faits de délinquance par rapport à la moyenne nationale obtient 7,5/10. Note = 10 - 5 x 0,5 = 7,5
Une ville pile dans la moyenne nationale (Valeur Ville = Valeur Référence Nationale) obtient 5/10. Note = 10 - 5 x 1 = 5
Une ville avec 2 fois plus de faits de délinquance par rapport à la moyenne nationale obtient 0/10. Note = 10 - 5 x 2 = 0
Note globale et mention officielle
L'Indice de Tranquillité final est la moyenne pondérée des 4 catégories de délinquance. Elle détermine la mention de la commune :
Note finale globale sur 10
Mention affichée
De 8,5 à 10 / 10
Optimale
De 6,5 à 8,4 / 10
Favorable
De 3,5 à 6,4 / 10
Contrastée
De 1,5 à 3,4 / 10
Dégradée
Moins de 1,5 / 10
Critique
Exemple concret : le calcul pour la ville de Labouheyre
L'analyse se base sur les indicateurs officiels de référence nationale :
Calcul de l'Indice Global : Note = ((6.3 x 3) + (10 x 2) + (9 x 1) + (7.8 x 1)) / 7 = 8 / 10
Avec une note de 8/10, la ville de Labouheyre se positionne dans la catégorie favorable
Evolution du nombre d'infractions
Pour comparer(en proportion du nombre d'habitants)
La ville
Bilan sécurité 2026 : la ville de Labouheyre est-elle sûre ?
L'examen récent des indices de criminalité à Labouheyre révèle une situation favorable. Le climat sécuritaire y est serein, avec des indicateurs de délinquance majoritairement inférieurs aux moyennes nationales.
Atteintes à l'intégrité physique : Concernant les atteintes à l'intégrité physique, la ville affiche un bilan positif avec un taux d'agressions et de violences volontaires nettement inférieur aux seuils nationaux. 6.3 faits recensés en 2025, en baisse de 72.6 % sur un an.
Cambriolages : La protection des domiciles est efficace : le taux de cambriolages de logements reste très inférieur à la moyenne, limitant l'exposition des résidents à ce risque. 10 effractions constatées en 2025, en progression de 0 % sur un an.
Vols et dégradations : La délinquance de proximité, incluant les vols et le vandalisme, est contenue. Les chiffres montrent une commune relativement épargnée par les dégradations urbaines. 9 infractions enregistrées en 2025, en recul de 82.7 % sur un an.
Stupéfiants : La lutte contre les stupéfiants présente des résultats probants : l'activité liée au trafic et à l'usage est quasi absente des registres officiels de la commune. 7.8 signalements en 2025, marquant une atténuation de 54.1 % sur un an.
Sources : Bases statistiques communale, départementale et régionale de la délinquance enregistrée par la police et la gendarmerie nationales selon les dernières parutions officielles de 2026 portant sur l'année 2025 (data.gouv).
La ville comptabilise de nombreux commerces divers et variés.
La ville compte 1 médecin pour 727 habitants.
Sources : Base Sirene des entreprises et de leurs établissements selon les dernières parutions officielles de 2025 portant sur l'année 2024 (data.gouv). Liste, localisation et tarifs des professionnels de santé selon les dernières parutions officielles de 2025 portant sur l'année 2024 (opendatasoft) et FINESS Extraction du Fichier des établissements selon les dernières parutions officielles de 2025 portant sur l'année 2024 (data.gouv). Adresse et géolocalisation des établissements d'enseignement du premier et second degrés selon les dernières parutions officielles de 2025 portant sur l'année 2024 (data.education.gouv)