CASTILLON LA BATAILLE PONT DE PIERRE
Auteur : JOCELYNE

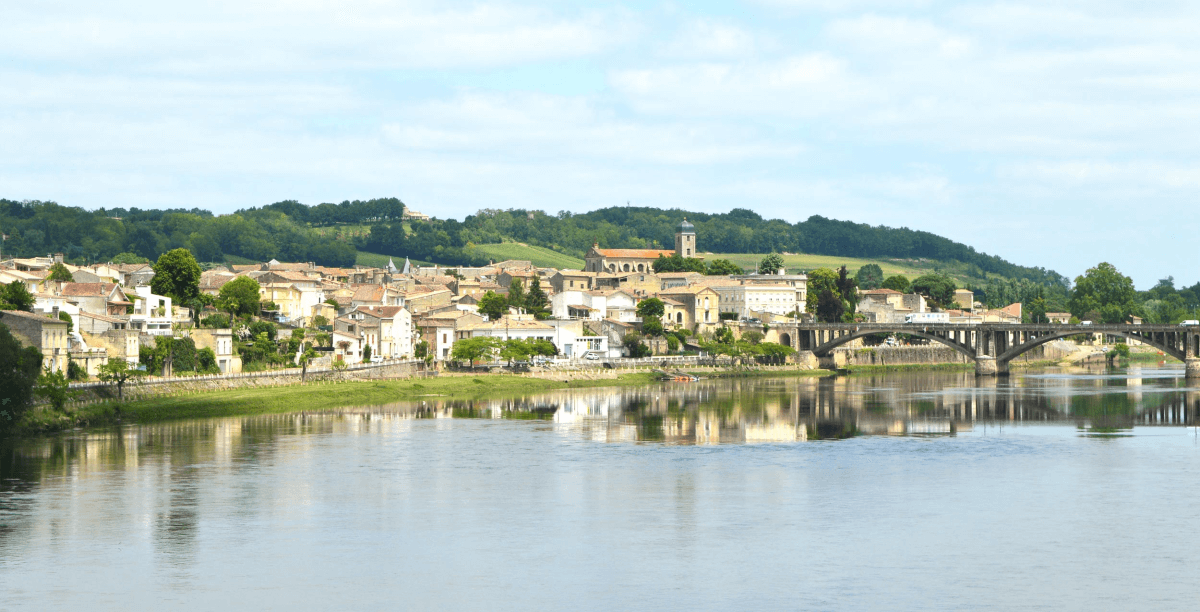
CASTILLON LA BATAILLE PONT DE PIERRE
Auteur : JOCELYNE
Nouveau : présentation de la ville en PDF à télécharger
(support de présentation gratuit).
Bienvenue à Castillon-la-Bataille, ville du département de la Gironde en région Nouvelle-Aquitaine. Comptabilisant aujourd'hui 3 344 habitants, la ville évolue en s'adaptant aux réalités de son territoire et aux besoins de sa population sous la gestion de son maire Jacques BREILLAT.
Profil de la population, sécurité, vie pratique, prix de l'immobilier : Petit tour d'horizon de Castillon-la-Bataille pour mieux comprendre son développement et ses perspectives.
Quel est le profil de la population, sa situation démographique ?
| Nombre d'habitants | 3 344 | Classement |
|---|---|---|
| Age moyen | 44 ans | Classement |
| Pop active | 36.1% | Classement |
| Taux chômage | 12.7% | Classement |
| Pop densité | 669 h/km² | Classement |
| Revenu moyen | 15 750 €/an | Classement |


Quels sont les résultats des dernières élections aux présidentiels 2022 ?
 Marine LE PEN
 Emmanuel MACRON
 Jean-Luc MÉLENCHON
 Éric ZEMMOUR
 Fabien ROUSSEL
 Jean LASSALLE
 Yannick JADOT
 Valérie PÉCRESSE
 Anne HIDALGO
 Nicolas DUPONT-AIGNAN
 Philippe POUTOU
 Nathalie ARTHAUDEmmanuel MACRONMarine LE PEN
| Agressions physiques / sexuelles | 71 |
|---|---|
| Cambriolages | 11 |
| Vols / dégradations | 126 |
| Stupéfiants | 24 |
Commerce |
|
|---|---|
|
Hypermarché Saint-Magne-de-Castillon 3km |
|
| Supermarché | 2 |
| Supérette | 1 |
| Boulangerie | 4 |
| Boucherie | 3 |
| Restaurant | 10 |
| Garage | 3 |
| Station-service | 1 |
| Banque | 6 |
| La poste | 9 |
| Coiffeur | 7 |
|
Tabac Saint-Magne-de-Castillon 1km |
|
| Bars / discothèque | 3 |
| Bibliothèque | 1 |
|
Cinéma Branne 12km |
|
| Vétérinaire | 1 |
Santé |
|
|---|---|
| Pharmacie | 4 |
| Hôpital | 1 |
| Laboratoire d'analyses médicales | 1 |
| Etablissement pour handicapé | 1 |
| EHPA | 1 |
| Médecin | 2 |
| Dentiste | 2 |
|
Chirurgien Libourne 17km |
|
|
Dermatologue Libourne 19km |
|
|
Anesthésiste Libourne 17km |
|
|
Gastro-entérologue Saint-André-de-Cubzac 36km |
|
|
Gynécologue Libourne 16km |
|
|
Cancérologue Langon 37km |
|
|
Neurologue Villefranche-de-Lonchat 13km |
|
| Ophtalmologue | 1 |
|
ORL Libourne 17km |
|
|
Cardiologue Saint-Magne-de-Castillon 2km |
|
|
Pédiatre Libourne 18km |
|
|
Pneumologue Libourne 18km |
|
|
Psychologue Libourne 16km |
|
|
Radiologue Libourne 16km |
|
|
Rhumatologue Libourne 17km |
|
|
Sage-femme Saint-Magne-de-Castillon 2km |
|
Éducation |
|
|---|---|
|
Crèche Saint-Magne-de-Castillon 2km |
|
| Ecole maternelle Public | 1 |
|
Ecole maternelle Privé La Brède 42km |
|
| Ecole primaire Public | 1 |
|
Ecole primaire Privé Saint-Émilion 11km |
|
| Collège Public | 1 |
|
Collège Privé Saint-Antoine-de-Breuilh 15km |
|
|
Lycée Public Montagne 16km |
|
|
Lycée Privé Libourne 18km |
|
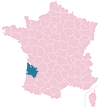
Carte de la ville de Castillon-la-Bataille


Les actes d'incivilités envahissent nos rues, agissons ! Un follow instagram = Un soutien
NOUVEAU : Décharges sauvages, détritus, objets abandonnés, graffitis, nids-de-poule : Déclarer un incident à Castillon-la-Bataille


| Ville | Habitants | Superficie | Pop densité | Pop active | Taux chômage | Revenu moyen | Prix immobilier | Note globale |
|---|---|---|---|---|---|---|---|---|
| Statistiques Sainte-Radegonde | 408 | 12 km² | 34 h/km² | 45.8% | 2.9% | 21 020 €/an | 1 201 €/m² | - |
| Statistiques Belvès-de-Castillon | 327 | 6 km² | 55 h/km² | 50.5% | 2.1% | 23 330 €/an | 1 155 €/m² | - |
| Statistiques Mouliets-et-Villemartin | 1 041 | 15 km² | 69 h/km² | 46.1% | 4.7% | 20 460 €/an | 1 406 €/m² | 3.7 |
| Statistiques Saint-Magne-de-Castillon | 2 165 | 13 km² | 167 h/km² | 43.2% | 5.2% | 21 620 €/an | 1 826 €/m² | - |
| Statistiques Sainte-Colombe | 423 | 4 km² | 106 h/km² | 50.6% | 6.4% | 23 330 €/an | 1 596 €/m² | - |
| Statistiques Civrac-sur-Dordogne | 206 | 1 km² | 206 h/km² | 53.4% | 3.9% | 19 940 €/an | 1 462 €/m² | - |
| Statistiques Saint-Pey-de-Castets | 588 | 11 km² | 53 h/km² | 48.6% | 5.6% | 22 660 €/an | 1 252 €/m² | - |
| Statistiques Lamothe-Montravel | 1 443 | 11 km² | 131 h/km² | 41.2% | 5.5% | 21 010 €/an | 1 352 €/m² | 2.8 |
| Statistiques Pujols | 524 | 7 km² | 75 h/km² | 46.6% | 3.2% | 20 270 €/an | 1 697 €/m² | - |
| Statistiques Saint-Michel-de-Montaigne | 336 | 9 km² | 37 h/km² | 46.4% | 7.1% | 21 070 €/an | 1 418 €/m² | - |
| Statistiques Gardegan-et-Tourtirac | 274 | 9 km² | 30 h/km² | 53.3% | 3.3% | 23 490 €/an | 1 458 €/m² | - |
| Statistiques Saint-Genès-de-Castillon | 361 | 6 km² | 60 h/km² | 45.4% | 4.4% | 22 100 €/an | 1 451 €/m² | - |
| Statistiques Saint-Pey-d'Armens | 187 | 4 km² | 47 h/km² | 49.7% | 3.7% | 22 050 €/an | 1 412 €/m² | - |
| Statistiques Saint-Étienne-de-Lisse | 180 | 7 km² | 26 h/km² | 55.6% | 8.9% | 21 180 €/an | 1 176 €/m² | - |
| Statistiques Saint-Christophe-des-Bardes | 386 | 7 km² | 55 h/km² | 47.2% | 4.1% | 24 580 €/an | 2 140 €/m² | - |