


Signalement de photo
Merci ! Votre signalement est envoyé !
Quel est le nombre d'habitants à Le Beausset ? Dans quel département et dans quelle région se situe la ville ? Quelle est sa superficie ?
Quels sont les chiffres de la délinquance ?
Découvrez sur cette page toutes les informations essentielles sur la population, la sécurité, les services et l'immobilier à Le Beausset.
NOUVEAU : Rues sales, dépôts sauvages, dégradations urbaines. Faites votre signalement anonyme, nous nous chargeons de prévenir les autorités compétentes.
| Nombre d'habitants | 10 007 | Classement |
| Age moyen | 45 ans | Classement |
| Pop active | 44.9% | Classement |
| Taux chômage | 4.7% | Classement |
| Pop densité | 278 h/km² | Classement |
| Revenu moyen | 25 180 €/an | Classement |
| Agressions physiques / sexuelles | 73 |
| Cambriolages | 30 |
| Vols / dégradations | 172 |
| Stupéfiants | 33 |
Achat / Vente / Location Votre agence immobilière à Le Beausset
| Prix moyen | 344 693 € | Prix moyen au m² | 3 255 € |
| Prix moyen | 155 248 € | Prix moyen au m² | 2 803 € |
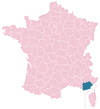
Carte de la ville de Le Beausset

Commerce |
|
|---|---|
|
Hypermarché (8km) Ollioules |
|
| Supermarché | 2 |
| Boulangerie | 6 |
| Boucherie | 2 |
| Station-service | 2 |
| Banque | 8 |
| La poste | 1 |
| Coiffeur | 21 |
| Vétérinaire | 3 |
| Restaurant | 27 |
Santé |
|
|---|---|
| Médecin | 29 |
| Dentiste | 13 |
| Pharmacie | 4 |
Éducation |
|
|---|---|
| Maternelle | 4 |
| Primaire | 2 |
| Collège | 1 |
|
Lycée (8km) Ollioules |
|


NOUVEAU : Décharges sauvages, détritus, objets abandonnés, graffitis, nids-de-poule : Déclarer un incident à Le Beausset


 Marine LE PEN
 Emmanuel MACRON
 Jean-Luc MÉLENCHON
 Éric ZEMMOUR
 Valérie PÉCRESSE
 Yannick JADOT
 Jean LASSALLE
 Nicolas DUPONT-AIGNAN
 Fabien ROUSSEL
 Anne HIDALGO
 Philippe POUTOU
 Nathalie ARTHAUDEmmanuel MACRONMarine LE PEN
| Ville | Habitants | Superficie | Pop densité | Pop active | Taux chômage | Revenu moyen | Prix immobilier | Note globale |
|---|---|---|---|---|---|---|---|---|
| Statistiques Le Castellet | 5 285 | 45 km² | 117 h/km² | 41.6% | 3.8% | 24 620 €/an | 4 180 €/m² | 3.5 |
| Statistiques La Cadière-d'Azur | 5 602 | 37 km² | 151 h/km² | 44.1% | 4.4% | 29 800 €/an | 4 635 €/m² | 3.2 |
| Statistiques Évenos | 2 407 | 42 km² | 57 h/km² | 48.7% | 4.4% | 25 580 €/an | 3 658 €/m² | 3.8 |
| Statistiques Saint-Cyr-sur-Mer | 12 103 | 21 km² | 576 h/km² | 38.9% | 4.6% | 26 690 €/an | 4 885 €/m² | 3.8 |
| Statistiques Ollioules | 14 011 | 20 km² | 701 h/km² | 44.4% | 4.7% | 25 060 €/an | 3 670 €/m² | 3.8 |
| Statistiques Bandol | 8 311 | 9 km² | 923 h/km² | 34.8% | 4.1% | 26 210 €/an | 5 546 €/m² | 3.4 |
| Statistiques Sanary-sur-Mer | 17 268 | 19 km² | 909 h/km² | 34.6% | 4.3% | 26 150 €/an | 5 172 €/m² | 3.5 |
| Statistiques Riboux | 51 | 13 km² | 4 h/km² | 60.8% | 9.8% | NC | NC | - |
| Statistiques Six-Fours-les-Plages | 36 203 | 27 km² | 1 341 h/km² | 38.3% | 4.7% | 24 660 €/an | 4 283 €/m² | 3.2 |
| Statistiques Cuges-les-Pins | 5 662 | 39 km² | 145 h/km² | 46.8% | 5.2% | 25 090 €/an | 3 261 €/m² | 1.6 |
| Statistiques Signes | 3 059 | 133 km² | 23 h/km² | 49.4% | 4.9% | 23 520 €/an | 3 604 €/m² | 3.5 |
| Statistiques La Seyne-sur-Mer | 62 763 | 22 km² | 2 853 h/km² | 40.9% | 6.4% | 21 400 €/an | 3 026 €/m² | 2.6 |
| Statistiques Ceyreste | 4 813 | 23 km² | 209 h/km² | 44.8% | 3.9% | 28 010 €/an | 4 569 €/m² | 3.8 |
| Statistiques Toulon | 180 452 | 43 km² | 4 197 h/km² | 42.7% | 6.2% | 20 960 €/an | 2 629 €/m² | 3.1 |
| Statistiques Roquefort-la-Bédoule | 5 861 | 31 km² | 189 h/km² | 45% | 3.4% | 27 130 €/an | 3 690 €/m² | 3.6 |