


Signalement de photo
Merci ! Votre signalement est envoyé !
Quel est le nombre d'habitants à Les Arcs ? Dans quel département et dans quelle région se situe la ville ? Quelle est sa superficie ?
Quels sont les chiffres de la délinquance ?
Découvrez sur cette page toutes les informations essentielles sur la population, la sécurité, les services et l'immobilier à Les Arcs.
NOUVEAU : Rues sales, dépôts sauvages, dégradations urbaines. Faites votre signalement anonyme, nous nous chargeons de prévenir les autorités compétentes.
| Nombre d'habitants | 7 580 | Classement |
| Age moyen | 43 ans | Classement |
| Pop active | 42.7% | Classement |
| Taux chômage | 6.7% | Classement |
| Pop densité | 140 h/km² | Classement |
| Revenu moyen | 22 470 €/an | Classement |
| Agressions physiques / sexuelles | 105 |
| Cambriolages | 29 |
| Vols / dégradations | 242 |
| Stupéfiants | 51 |
Achat / Vente / Location Votre agence immobilière à Les Arcs
| Prix moyen | 221 129 € | Prix moyen au m² | 2 167 € |
| Prix moyen | 152 691 € | Prix moyen au m² | 3 186 € |
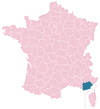
Carte de la ville de Les Arcs

Commerce |
|
|---|---|
| Hypermarché | 1 |
|
Supermarché (5km) Vidauban |
|
| Boulangerie | 6 |
| Boucherie | 2 |
| Station-service | 1 |
| Banque | 6 |
| La poste | 1 |
| Coiffeur | 7 |
| Vétérinaire | 2 |
| Restaurant | 31 |
Santé |
|
|---|---|
| Médecin | 7 |
| Dentiste | 4 |
| Pharmacie | 2 |
Éducation |
|
|---|---|
| Maternelle | 3 |
| Primaire | 2 |
| Collège | 1 |
| Lycée | 1 |

NOUVEAU : Décharges sauvages, détritus, objets abandonnés, graffitis, nids-de-poule : Déclarer un incident à Les Arcs


 Marine LE PEN
 Emmanuel MACRON
 Jean-Luc MÉLENCHON
 Éric ZEMMOUR
 Yannick JADOT
 Valérie PÉCRESSE
 Jean LASSALLE
 Nicolas DUPONT-AIGNAN
 Fabien ROUSSEL
 Anne HIDALGO
 Philippe POUTOU
 Nathalie ARTHAUDEmmanuel MACRONMarine LE PEN
| Ville | Habitants | Superficie | Pop densité | Pop active | Taux chômage | Revenu moyen | Prix immobilier | Note globale |
|---|---|---|---|---|---|---|---|---|
| Statistiques La Motte | 2 968 | 28 km² | 106 h/km² | 43.5% | 4.5% | 23 620 €/an | 3 185 €/m² | 2.2 |
| Statistiques Taradeau | 1 854 | 17 km² | 109 h/km² | 40.3% | 5.6% | 23 800 €/an | 2 740 €/m² | - |
| Statistiques Trans-en-Provence | 6 285 | 17 km² | 370 h/km² | 44.6% | 6.1% | 24 780 €/an | 2 546 €/m² | 3.2 |
| Statistiques Le Muy | 9 646 | 67 km² | 144 h/km² | 38.2% | 6.7% | 21 040 €/an | 2 535 €/m² | 3.8 |
| Statistiques Vidauban | 12 573 | 74 km² | 170 h/km² | 45.6% | 6.4% | 21 320 €/an | 2 705 €/m² | 3.2 |
| Statistiques Draguignan | 39 745 | 54 km² | 736 h/km² | 42.3% | 6.8% | 21 510 €/an | 2 077 €/m² | 3.4 |
| Statistiques Lorgues | 9 542 | 64 km² | 149 h/km² | 38.1% | 4.9% | 23 200 €/an | 2 703 €/m² | 3.6 |
| Statistiques Flayosc | 4 354 | 46 km² | 95 h/km² | 40.9% | 5.7% | 24 580 €/an | 2 975 €/m² | 3.4 |
| Statistiques Figanières | 2 610 | 28 km² | 93 h/km² | 42.1% | 5.5% | 23 630 €/an | 2 276 €/m² | 4.5 |
| Statistiques Le Cannet-des-Maures | 4 592 | 74 km² | 62 h/km² | 42.4% | 6.1% | 22 860 €/an | 2 672 €/m² | 4.1 |
| Statistiques Le Revest-les-Eaux | 4 002 | 24 km² | 167 h/km² | 45.4% | 3.5% | 27 590 €/an | 3 382 €/m² | 4.8 |
| Statistiques Roquebrune-sur-Argens | 14 448 | 106 km² | 136 h/km² | 43.1% | 5.1% | 24 940 €/an | 4 223 €/m² | 3.6 |
| Statistiques Châteaudouble | 477 | 41 km² | 12 h/km² | 48% | 7.5% | 20 820 €/an | 2 271 €/m² | - |
| Statistiques Callas | 2 015 | 49 km² | 41 h/km² | 43.8% | 7.3% | 22 700 €/an | 2 921 €/m² | - |
| Statistiques Le Thoronet | 2 613 | 38 km² | 69 h/km² | 43.2% | 5.7% | 23 740 €/an | 2 959 €/m² | 2.9 |