


Signalement de photo
Merci ! Votre signalement est envoyé !
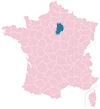
Quel est le nombre d'habitants à Villenoy ? Dans quel département et dans quelle région se situe la ville ? Quelle est sa superficie ?
Quels sont les chiffres de la délinquance ?
Découvrez sur cette page toutes les informations essentielles sur la population, la sécurité, les services et l'immobilier à Villenoy.
NOUVEAU : Rues sales, dépôts sauvages, dégradations urbaines. Faites votre signalement anonyme, nous nous chargeons de prévenir les autorités compétentes.
| Nombre d'habitants | 5 019 | Classement |
| Age moyen | 36 ans | Classement |
| Pop active | 56.4% | Classement |
| Taux chômage | 5.7% | Classement |
| Pop densité | 717 h/km² | Classement |
| Revenu moyen | 24 730 €/an | Classement |
| Agressions physiques / sexuelles | 52 |
| Cambriolages | 20 |
| Vols / dégradations | 65 |
| Stupéfiants | 15 |
Achat / Vente / Location Votre agence immobilière à Villenoy
| Prix moyen | 255 400 € | Prix moyen au m² | 2 963 € |
| Prix moyen | 165 003 € | Prix moyen au m² | 3 381 € |
Carte de la ville de Villenoy

Commerce |
|
|---|---|
|
Hypermarché (0km) Meaux |
|
|
Supermarché (0km) Meaux |
|
| Boulangerie | 5 |
|
Boucherie (0km) Meaux |
|
|
Station-service (0km) Meaux |
|
|
Banque (0km) Meaux |
|
| La poste | 1 |
| Coiffeur | 4 |
|
Vétérinaire (0km) Meaux |
|
| Restaurant | 1 |
Santé |
|
|---|---|
| Médecin | 4 |
| Dentiste | 1 |
| Pharmacie | 1 |


NOUVEAU : Décharges sauvages, détritus, objets abandonnés, graffitis, nids-de-poule : Déclarer un incident à Villenoy


 Jean-Luc MÉLENCHON
 Marine LE PEN
 Emmanuel MACRON
 Éric ZEMMOUR
 Valérie PÉCRESSE
 Yannick JADOT
 Fabien ROUSSEL
 Nicolas DUPONT-AIGNAN
 Jean LASSALLE
 Anne HIDALGO
 Philippe POUTOU
 Nathalie ARTHAUDEmmanuel MACRONMarine LE PEN
| Ville | Habitants | Superficie | Pop densité | Pop active | Taux chômage | Revenu moyen | Prix immobilier | Note globale |
|---|---|---|---|---|---|---|---|---|
| Statistiques Meaux | 55 616 | 15 km² | 3 708 h/km² | 48.5% | 7.2% | 20 010 €/an | 2 758 €/m² | 3.9 |
| Statistiques Mareuil-lès-Meaux | 3 304 | 7 km² | 472 h/km² | 47.2% | 5.2% | 26 130 €/an | 2 843 €/m² | 4.1 |
| Statistiques Nanteuil-lès-Meaux | 6 800 | 8 km² | 850 h/km² | 49.8% | 4.4% | 25 510 €/an | 2 710 €/m² | 2.6 |
| Statistiques Chauconin-Neufmontiers | 3 655 | 17 km² | 215 h/km² | 37.1% | 3.4% | 26 410 €/an | 3 148 €/m² | 3.1 |
| Statistiques Penchard | 1 354 | 4 km² | 339 h/km² | 46.7% | 5.3% | 27 080 €/an | 2 446 €/m² | 1.0 |
| Statistiques Crégy-lès-Meaux | 5 354 | 4 km² | 1 339 h/km² | 52% | 5.2% | 24 800 €/an | 2 890 €/m² | 3.7 |
| Statistiques Vignely | 318 | 4 km² | 80 h/km² | 56.3% | 3.1% | 30 280 €/an | 3 379 €/m² | - |
| Statistiques Isles-lès-Villenoy | 1 140 | 7 km² | 163 h/km² | 54.9% | 5.6% | 28 620 €/an | 3 063 €/m² | - |
| Statistiques Trilbardou | 684 | 8 km² | 86 h/km² | 53.1% | 3.9% | 27 100 €/an | 3 332 €/m² | 2.5 |
| Statistiques Poincy | 764 | 6 km² | 127 h/km² | 48.6% | 4.2% | 28 610 €/an | 2 782 €/m² | - |
| Statistiques Quincy-Voisins | 5 435 | 10 km² | 544 h/km² | 51.3% | 3.7% | 27 360 €/an | 2 955 €/m² | 3.9 |
| Statistiques Chambry | 1 038 | 10 km² | 104 h/km² | 51.6% | 4.7% | 25 570 €/an | 2 032 €/m² | 2.8 |
| Statistiques Condé-Sainte-Libiaire | 1 438 | 2 km² | 719 h/km² | 47.9% | 4.2% | 29 670 €/an | 2 860 €/m² | 3.5 |
| Statistiques Trilport | 5 081 | 11 km² | 462 h/km² | 48.6% | 4.9% | 25 450 €/an | 2 731 €/m² | 3.4 |
| Statistiques Charmentray | 298 | 5 km² | 60 h/km² | 56.4% | 3.7% | 28 430 €/an | 2 074 €/m² | - |