


Signalement de photo
Merci ! Votre signalement est envoyé !
Quel est le nombre d'habitants à Sare ? Dans quel département et dans quelle région se situe la ville ? Quelle est sa superficie ?
Quels sont les chiffres de la délinquance ?
Découvrez sur cette page toutes les informations essentielles sur la population, la sécurité, les services et l'immobilier à Sare.
NOUVEAU : Rues sales, dépôts sauvages, dégradations urbaines. Faites votre signalement anonyme, nous nous chargeons de prévenir les autorités compétentes.
| Nombre d'habitants | 2 720 | Classement |
| Age moyen | 45 ans | Classement |
| Pop active | 45.4% | Classement |
| Taux chômage | 3.9% | Classement |
| Pop densité | 53 h/km² | Classement |
| Revenu moyen | 22 840 €/an | Classement |
| Agressions physiques / sexuelles | 0 |
| Cambriolages | 0 |
| Vols / dégradations | 0 |
| Stupéfiants | 0 |
Achat / Vente / Location Votre agence immobilière à Sare
| Prix moyen | 354 115 € | Prix moyen au m² | 2 384 € |
| Prix moyen | 192 035 € | Prix moyen au m² | 3 189 € |
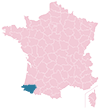
Carte de la ville de Sare

Commerce |
|
|---|---|
|
Hypermarché (10km) Saint-Jean-de-Luz |
|
|
Supermarché (5km) Saint-Pée-sur-Nivelle |
|
| Boulangerie | 2 |
| Boucherie | 1 |
|
Station-service (5km) Saint-Pée-sur-Nivelle |
|
|
Banque (5km) Saint-Pée-sur-Nivelle |
|
| La poste | 1 |
| Coiffeur | 7 |
| Vétérinaire | 2 |
| Restaurant | 9 |
Santé |
|
|---|---|
| Médecin | 3 |
| Dentiste | 2 |
| Pharmacie | 1 |
Éducation |
|
|---|---|
| Maternelle | 3 |
| Primaire | 3 |
|
Collège (5km) Saint-Pée-sur-Nivelle |
|
|
Lycée (5km) Saint-Pée-sur-Nivelle |
|


NOUVEAU : Décharges sauvages, détritus, objets abandonnés, graffitis, nids-de-poule : Déclarer un incident à Sare


 Emmanuel MACRON
 Jean LASSALLE
 Marine LE PEN
 Jean-Luc MÉLENCHON
 Philippe POUTOU
 Valérie PÉCRESSE
 Éric ZEMMOUR
 Yannick JADOT
 Fabien ROUSSEL
 Anne HIDALGO
 Nicolas DUPONT-AIGNAN
 Nathalie ARTHAUDEmmanuel MACRONMarine LE PEN
| Ville | Habitants | Superficie | Pop densité | Pop active | Taux chômage | Revenu moyen | Prix immobilier | Note globale |
|---|---|---|---|---|---|---|---|---|
| Statistiques Saint-Pée-sur-Nivelle | 7 170 | 65 km² | 110 h/km² | 47.6% | 3.4% | 23 070 €/an | 3 317 €/m² | 3.7 |
| Statistiques Ascain | 4 464 | 19 km² | 235 h/km² | 43.6% | 4.6% | 24 240 €/an | 3 742 €/m² | - |
| Statistiques Ainhoa | 667 | 16 km² | 42 h/km² | 48.6% | 4.2% | 21 660 €/an | 1 934 €/m² | - |
| Statistiques Ahetze | 2 049 | 11 km² | 186 h/km² | 48.6% | 4.1% | 25 570 €/an | 3 789 €/m² | 3.6 |
| Statistiques Saint-Jean-de-Luz | 14 601 | 19 km² | 768 h/km² | 38.4% | 6% | 23 390 €/an | 5 220 €/m² | 3.6 |
| Statistiques Ciboure | 6 033 | 7 km² | 862 h/km² | 39.5% | 4.8% | 23 710 €/an | 4 577 €/m² | - |
| Statistiques Souraïde | 1 506 | 17 km² | 89 h/km² | 48.2% | 3.7% | 23 540 €/an | 3 123 €/m² | 2.0 |
| Statistiques Urrugne | 10 543 | 51 km² | 207 h/km² | 45.9% | 4% | 23 800 €/an | 3 622 €/m² | 1.4 |
| Statistiques Espelette | 2 032 | 27 km² | 75 h/km² | 48.1% | 4.9% | 23 460 €/an | 3 021 €/m² | 2.1 |
| Statistiques Guéthary | 1 323 | 1 km² | 1 323 h/km² | 42.9% | 6.3% | 25 090 €/an | 4 742 €/m² | 1.6 |
| Statistiques Biriatou | 1 217 | 11 km² | 111 h/km² | 50.7% | 4.5% | 24 210 €/an | 2 527 €/m² | - |
| Statistiques Bidart | 7 449 | 12 km² | 621 h/km² | 47% | 4.9% | 24 990 €/an | 4 665 €/m² | 4.0 |
| Statistiques Arbonne | 2 344 | 11 km² | 213 h/km² | 47.2% | 4.1% | 27 300 €/an | 5 245 €/m² | 4.0 |
| Statistiques Larressore | 2 129 | 11 km² | 194 h/km² | 49.6% | 3.1% | 24 180 €/an | 2 614 €/m² | - |
| Statistiques Arcangues | 3 457 | 17 km² | 203 h/km² | 44% | 3% | 27 520 €/an | 4 356 €/m² | - |