


Signalement de photo
Merci ! Votre signalement est envoyé !
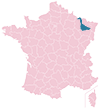
Quel est le nombre d'habitants à Pulnoy ? Dans quel département et dans quelle région se situe la ville ? Quelle est sa superficie ?
Quels sont les chiffres de la délinquance ?
Découvrez sur cette page toutes les informations essentielles sur la population, la sécurité, les services et l'immobilier à Pulnoy.
NOUVEAU : Rues sales, dépôts sauvages, dégradations urbaines. Faites votre signalement anonyme, nous nous chargeons de prévenir les autorités compétentes.
| Nombre d'habitants | 5 144 | Classement |
| Age moyen | 43 ans | Classement |
| Pop active | 43.7% | Classement |
| Taux chômage | 4.8% | Classement |
| Pop densité | 1 286 h/km² | Classement |
| Revenu moyen | 24 590 €/an | Classement |
| Agressions physiques / sexuelles | 20 |
| Cambriolages | 0 |
| Vols / dégradations | 98 |
| Stupéfiants | 0 |
Achat / Vente / Location Votre agence immobilière à Pulnoy
| Prix moyen | 258 536 € | Prix moyen au m² | 2 375 € |
| Prix moyen | 127 463 € | Prix moyen au m² | 1 770 € |
Carte de la ville de Pulnoy

Commerce |
|
|---|---|
|
Hypermarché (2km) Essey-lès-Nancy |
|
|
Supermarché (2km) Seichamps |
|
| Boulangerie | 2 |
|
Boucherie (2km) Essey-lès-Nancy |
|
|
Station-service (2km) Seichamps |
|
|
Banque (2km) Seichamps |
|
| La poste | 1 |
| Coiffeur | 4 |
|
Vétérinaire (2km) Essey-lès-Nancy |
|
| Restaurant | 6 |
Santé |
|
|---|---|
| Médecin | 7 |
| Dentiste | 3 |
| Pharmacie | 2 |
Éducation |
|
|---|---|
| Maternelle | 2 |
| Primaire | 2 |
| Collège | 1 |
|
Lycée (4km) Tomblaine |
|


NOUVEAU : Décharges sauvages, détritus, objets abandonnés, graffitis, nids-de-poule : Déclarer un incident à Pulnoy


 Emmanuel MACRON
 Marine LE PEN
 Jean-Luc MÉLENCHON
 Éric ZEMMOUR
 Yannick JADOT
 Valérie PÉCRESSE
 Jean LASSALLE
 Nicolas DUPONT-AIGNAN
 Fabien ROUSSEL
 Anne HIDALGO
 Philippe POUTOU
 Nathalie ARTHAUDEmmanuel MACRONMarine LE PEN
| Ville | Habitants | Superficie | Pop densité | Pop active | Taux chômage | Revenu moyen | Prix immobilier | Note globale |
|---|---|---|---|---|---|---|---|---|
| Statistiques Seichamps | 5 141 | 4 km² | 1 285 h/km² | 42.6% | 4.1% | 24 570 €/an | 2 013 €/m² | 3.4 |
| Statistiques Saulxures-lès-Nancy | 4 285 | 7 km² | 612 h/km² | 42.5% | 4.1% | 25 490 €/an | 1 948 €/m² | 2.8 |
| Statistiques Essey-lès-Nancy | 8 782 | 6 km² | 1 464 h/km² | 46.8% | 6.4% | 22 890 €/an | 2 018 €/m² | 4.0 |
| Statistiques Cerville | 550 | 8 km² | 69 h/km² | 49.1% | 2.9% | 27 110 €/an | 1 652 €/m² | - |
| Statistiques Saint-Max | 10 073 | 2 km² | 5 037 h/km² | 47% | 5.8% | 22 560 €/an | 1 729 €/m² | 4.2 |
| Statistiques Velaine-sous-Amance | 282 | 6 km² | 47 h/km² | 47.5% | 6% | 24 540 €/an | 2 196 €/m² | 4.6 |
| Statistiques Dommartemont | 570 | 1 km² | 570 h/km² | 39.8% | 2.1% | 39 430 €/an | 3 221 €/m² | - |
| Statistiques Tomblaine | 9 019 | 6 km² | 1 503 h/km² | 45.3% | 5.7% | 21 630 €/an | 1 912 €/m² | 2.9 |
| Statistiques Laneuvelotte | 436 | 9 km² | 48 h/km² | 46.6% | 2.1% | 26 500 €/an | 2 110 €/m² | - |
| Statistiques Agincourt | 449 | 4 km² | 112 h/km² | 47% | 3.3% | 28 060 €/an | 1 645 €/m² | - |
| Statistiques Lenoncourt | 591 | 12 km² | 49 h/km² | 49.9% | 3.7% | 25 790 €/an | 1 999 €/m² | - |
| Statistiques Dommartin-sous-Amance | 302 | 4 km² | 76 h/km² | 46.7% | 1.7% | 29 640 €/an | 1 465 €/m² | - |
| Statistiques Jarville-la-Malgrange | 9 374 | 2 km² | 4 687 h/km² | 43.4% | 7.4% | 19 320 €/an | 1 587 €/m² | 3.0 |
| Statistiques Malzéville | 7 927 | 8 km² | 991 h/km² | 46.7% | 4.4% | 23 270 €/an | 1 813 €/m² | 4.7 |
| Statistiques Nancy | 104 260 | 15 km² | 6 951 h/km² | 46.9% | 7.8% | 22 360 €/an | 2 020 €/m² | 3.4 |