


Signalement de photo
Merci ! Votre signalement est envoyé !
Quel est le nombre d'habitants à Sèvremont ? Dans quel département et dans quelle région se situe la ville ? Quelle est sa superficie ?
Quels sont les chiffres de la délinquance ?
Découvrez sur cette page toutes les informations essentielles sur la population, la sécurité, les services et l'immobilier à Sèvremont.
NOUVEAU : Rues sales, dépôts sauvages, dégradations urbaines. Faites votre signalement anonyme, nous nous chargeons de prévenir les autorités compétentes.
| Nombre d'habitants | 6 391 | Classement |
| Age moyen | 40 ans | Classement |
| Pop active | 50.8% | Classement |
| Taux chômage | 3.9% | Classement |
| Pop densité | 72 h/km² | Classement |
| Revenu moyen | 21 890 €/an | Classement |
| Agressions physiques / sexuelles | 15 |
| Cambriolages | 0 |
| Vols / dégradations | 37 |
| Stupéfiants | 0 |
Achat / Vente / Location Votre agence immobilière à Sèvremont
| Prix moyen | 119 044 € | Prix moyen au m² | 1 246 € |
| Prix moyen | 39 475 € | Prix moyen au m² | 859 € |
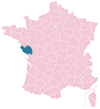
Carte de la ville de Sèvremont

Commerce |
|
|---|---|
|
Hypermarché (6km) Pouzauges |
|
|
Supermarché (5km) Le Boupère |
|
| Boulangerie | 2 |
| Boucherie | 1 |
|
Station-service (5km) Le Boupère |
|
| Banque | 4 |
| La poste | 1 |
| Coiffeur | 10 |
|
Vétérinaire (6km) Pouzauges |
|
| Restaurant | 11 |
Santé |
|
|---|---|
| Médecin | 1 |
|
Dentiste (1km) Sèvremont |
|
| Pharmacie | 1 |

NOUVEAU : Décharges sauvages, détritus, objets abandonnés, graffitis, nids-de-poule : Déclarer un incident à Sèvremont


 Emmanuel MACRON
 Marine LE PEN
 Jean-Luc MÉLENCHON
 Valérie PÉCRESSE
 Éric ZEMMOUR
 Yannick JADOT
 Jean LASSALLE
 Nicolas DUPONT-AIGNAN
 Anne HIDALGO
 Fabien ROUSSEL
 Nathalie ARTHAUD
 Philippe POUTOUEmmanuel MACRONMarine LE PEN
| Ville | Habitants | Superficie | Pop densité | Pop active | Taux chômage | Revenu moyen | Prix immobilier | Note globale |
|---|---|---|---|---|---|---|---|---|
| Statistiques Le Boupère | 3 189 | 43 km² | 74 h/km² | 49.6% | 2.2% | 21 660 €/an | 1 146 €/m² | - |
| Statistiques Pouzauges | 5 597 | 37 km² | 151 h/km² | 46.1% | 4.3% | 22 320 €/an | 1 103 €/m² | 4.0 |
| Statistiques Saint-Amand-sur-Sèvre | 1 415 | 32 km² | 44 h/km² | 45.9% | 4% | 22 070 €/an | 1 014 €/m² | 4.2 |
| Statistiques Les Epesses | 2 984 | 31 km² | 96 h/km² | 50% | 3.6% | 22 220 €/an | 1 583 €/m² | 3.8 |
| Statistiques Saint-Mars-la-Réorthe | 1 023 | 9 km² | 114 h/km² | 48.2% | 3.6% | 22 320 €/an | 1 483 €/m² | - |
| Statistiques Mallièvre | 241 | 0 km² | 241 h/km² | 51.5% | 5% | 25 210 €/an | 1 298 €/m² | - |
| Statistiques Treize-Vents | 1 242 | 19 km² | 65 h/km² | 47.7% | 4.3% | 21 620 €/an | 1 192 €/m² | - |
| Statistiques Rochetrejoux | 983 | 11 km² | 89 h/km² | 48.7% | 2% | 22 150 €/an | 1 231 €/m² | - |
| Statistiques La Petite-Boissière | 633 | 13 km² | 49 h/km² | 49.1% | 3.2% | 21 770 €/an | 1 169 €/m² | 2.3 |
| Statistiques Saint-Mesmin | 1 754 | 26 km² | 67 h/km² | 46.8% | 3.5% | 22 330 €/an | 1 090 €/m² | 1.6 |
| Statistiques Saint-Paul-en-Pareds | 1 348 | 12 km² | 112 h/km² | 51.2% | 2.7% | 23 370 €/an | 1 315 €/m² | 4.8 |
| Statistiques Saint-Prouant | 1 675 | 13 km² | 129 h/km² | 50.3% | 4.6% | 22 500 €/an | 1 195 €/m² | - |
| Statistiques Montravers | 366 | 10 km² | 37 h/km² | 48.4% | 3.8% | 22 020 €/an | 966 €/m² | - |
| Statistiques La Meilleraie-Tillay | 1 493 | 20 km² | 75 h/km² | 46% | 3.1% | 21 740 €/an | 996 €/m² | 4.3 |
| Statistiques Saint-Malô-du-Bois | 1 618 | 14 km² | 116 h/km² | 53% | 2.2% | 23 950 €/an | 1 604 €/m² | 5.0 |