
Bienvenue à Le Pecq, ville du département des Yvelines en région Île-de-France. Comptabilisant aujourd'hui 16 059 habitants, la ville évolue en s'adaptant aux réalités de son territoire et aux besoins de sa population sous la gestion de son maire Anne-Laure DEBROSSES.
Présentation

Statistiques sur la population
Quel est le profil de la population, sa situation démographique ?
| Nombre d'habitants | 16 059 | Classement |
|---|---|---|
| Age moyen | 41 ans | Classement |
| Pop active | 46.5% | Classement |
| Taux chômage | 5.6% | Classement |
| Pop densité | 8 030 h/km² | Classement |
| Revenu moyen | 30 800 €/an | Classement |
Evolution du nombre d'habitants
Aujourd'hui, en 2026, la population de Le Pecq est estimée à 15 705 habitants selon un modèle de régression linéaire appliqué aux dix dernières années. (15 739 en 2025).
Les derniers chiffres officiels publiés par la source INSEE en 2026 portent sur la population de 2023 qui enregistre une hausse de 1.3% sur un an.
Les derniers chiffres officiels publiés par la source INSEE en 2026 portent sur la population de 2023 qui enregistre une hausse de 1.3% sur un an.
Tranche d'âge


0-14 ans
19%

15-29 ans
16%

30-44 ans
18%

45-59 ans
22%

60-74 ans
14%

75-89 ans
9%

90 ans et +
1%
Activité professionnelle


Agriculteurs
0%

Artisans, Commerçants
2%

Cadres et sup.
21%

Professions intermédiaires
12%

Employé
8%

Ouvrier
3%

Retraité
19%

Autres
15%
Niveau de diplôme


Sans diplôme ou CEP
11%

Brevet, BEPC, DNB
3%

CAP-BEP ou équivalent
13%

BAC ou équivalent
15%

BAC+2
12%

BAC+3 ou +4
16%

BAC+5 ou plus
31%
Composition des ménages


Couple sans enfant
28%

Couple avec enfant(s)
39%

Famille monoparentale
6%

Colocation / Autre
2%

Personnes seules
24%
Profils électoraux
Quels sont les résultats des dernières élections aux présidentiels 2022 ?
Premier tour
 Emmanuel MACRON
38.04 %
 Jean-Luc MÉLENCHON
18.24 %
 Marine LE PEN
10.94 %
 Éric ZEMMOUR
10.63 %
 Valérie PÉCRESSE
8.97 %
 Yannick JADOT
5.92 %
 Jean LASSALLE
1.92 %
 Nicolas DUPONT-AIGNAN
1.85 %
 Fabien ROUSSEL
1.46 %
 Anne HIDALGO
1.27 %
 Philippe POUTOU
0.46 %
 Nathalie ARTHAUD
0.31 %
10 663 inscrits
Participation : 76.49%
Votes blancs : 1.12%
Votes nuls : 0.34%
Participation : 76.49%
Votes blancs : 1.12%
Votes nuls : 0.34%
Second tour
Emmanuel MACRON73,6 %
Marine LE PEN26,4 %
10 662 inscrits
Participation : 73.45%
Votes blancs : 4.93%
Votes nuls : 1.48%
Participation : 73.45%
Votes blancs : 4.93%
Votes nuls : 1.48%
Bon à savoir :
- Le revenu moyen par habitant à Le Pecq (30 800 €) est au dessus de la moyenne nationale (20 590 €).
- La part de la population au chômage (5.6%) est inférieure à la moyenne nationale (8%).
- Le taux de chômage indiqué est au sens du BIT qui se distingue du taux de chômage au sens du recensement de la population.
Sources : Institut national de la statistique et des études économiques (insee) selon Les dernières parutions officielles de 2025 portant sur les années 2020, 2021 et 2022.
Sécurité, faits divers : les chiffres de la délinquance
| Agressions physiques / sexuelles | 76 |
|---|---|
| Cambriolages | 44 |
| Vols / dégradations | 295 |
| Stupéfiants | 54 |
Evolution du nombre d'infractions
Pour comparer(en proportion du nombre d'habitants)
La ville
Bilan sécurité 2025 : la ville de Le Pecq est-elle sûre ?
L'examen des indices de criminalité à Le Pecq pour l'année 2025 révèle une situation favorable. Le climat sécuritaire y est serein, avec des indicateurs de délinquance majoritairement inférieurs aux moyennes nationales.
- Atteintes à l'intégrité physique : Concernant les atteintes à l'intégrité physique, la ville affiche un bilan positif avec un taux d'agressions et de violences volontaires nettement inférieur aux seuils nationaux.
- Cambriolages : L'indice de cambriolages de logements s'inscrit dans la norme nationale. La fréquence des effractions enregistrées à Le Pecq ne présente pas d'anomalie statistique.
- Vols et dégradations : La délinquance de proximité, incluant les vols et le vandalisme, est contenue. Les chiffres montrent une commune relativement épargnée par les dégradations urbaines.
- Stupéfiants : La lutte contre les stupéfiants présente des résultats probants : l'activité liée au trafic et à l'usage est quasi absente des registres officiels de la commune.
Sources : Bases statistiques communale, départementale et régionale de la délinquance enregistrée par la police et la gendarmerie nationales selon les dernières parutions officielles de 2026 portant sur l'année 2025 (data.gouv).
Agressions physiques / sexuelles : Violences sexuelles, coups et blessures volontaires intrafamiliaux, coups et blessures volontaires, autres coups, blessures volontaires et vols violents sans arme.
Cambriolages : Cambriolages de logements.
Vols : Vols avec armes, vols d'accessoires sur véhicules, vols dans les véhicules, vols de véhicules, vols sans violence contre des personnes, destructions, dégradations volontaires et escroqueries.
Stupéfiants : Trafic de stupéfiants dont (AFD) et usage de stupéfiants.
Services à la population
Commerce |
|
|---|---|
|
Hypermarché Saint-Germain-en-Laye 1km |
|
|
Supermarché Saint-Germain-en-Laye 0km |
|
| Supérette | 10 |
| Boulangerie | 5 |
| Boucherie | 2 |
| Restaurant | 13 |
| Garage | 7 |
| Station-service | 3 |
|
Banque Saint-Germain-en-Laye 1km |
|
| La poste | 80 |
| Coiffeur | 12 |
|
Tabac Saint-Germain-en-Laye 0km |
|
| Bars / discothèque | 6 |
| Bibliothèque | 1 |
|
Cinéma Saint-Germain-en-Laye 1km |
|
|
Vétérinaire Saint-Germain-en-Laye 1km |
|
Santé |
|
|---|---|
| Pharmacie | 4 |
|
Hôpital Saint-Germain-en-Laye 1km |
|
|
Laboratoire d'analyses médicales Saint-Germain-en-Laye 0km |
|
| Etablissement pour handicapé | 1 |
| EHPA | 2 |
| Médecin | 6 |
| Dentiste | 6 |
|
Chirurgien Saint-Germain-en-Laye 1km |
|
|
Dermatologue Saint-Germain-en-Laye 1km |
|
|
Anesthésiste Saint-Germain-en-Laye 1km |
|
|
Gastro-entérologue Saint-Germain-en-Laye 1km |
|
|
Gynécologue Saint-Germain-en-Laye 1km |
|
|
Cancérologue La Garenne-Colombes 10km |
|
|
Neurologue Saint-Germain-en-Laye 1km |
|
|
Ophtalmologue Saint-Germain-en-Laye 1km |
|
|
ORL Saint-Germain-en-Laye 1km |
|
|
Cardiologue Saint-Germain-en-Laye 1km |
|
|
Pédiatre Saint-Germain-en-Laye 0km |
|
|
Pneumologue Saint-Germain-en-Laye 1km |
|
|
Psychologue Saint-Germain-en-Laye 1km |
|
|
Radiologue Saint-Germain-en-Laye 1km |
|
|
Rhumatologue Saint-Germain-en-Laye 0km |
|
| Sage-femme | 1 |
Éducation |
|
|---|---|
| Crèche | 19 |
| Ecole maternelle Public | 3 |
|
Ecole maternelle Privé Saint-Germain-en-Laye 2km |
|
| Ecole primaire Public | 5 |
| Ecole primaire Privé | 1 |
| Collège Public | 2 |
|
Collège Privé Saint-Germain-en-Laye 0km |
|
|
Lycée Public Saint-Germain-en-Laye 1km |
|
| Lycée Privé | 1 |
Bon à savoir :
- La ville ne possède pas de grands magasins alimentaire.
- La ville compte 1 médecin pour 2677 habitants.
- La ville dispose de plusieurs établissements scolaire public mais pas de lycée.
Sources : Base Sirene des entreprises et de leurs établissements selon les dernières parutions officielles de 2025 portant sur l'année 2024 (data.gouv). Liste, localisation et tarifs des professionnels de santé selon les dernières parutions officielles de 2025 portant sur l'année 2024 (opendatasoft) et FINESS Extraction du Fichier des établissements selon les dernières parutions officielles de 2025 portant sur l'année 2024 (data.gouv). Adresse et géolocalisation des établissements d'enseignement du premier et second degrés selon les dernières parutions officielles de 2025 portant sur l'année 2024 (data.education.gouv)
Carte et superficie

Carte de la ville de Le Pecq
Bon à savoir :
- Le Pecq est rattachée aux collectivités territoriales de la région Île-de-France, du département Yvelines
- Le code postal de Le Pecq est 78230.
- Le Pecq s'étend sur une superficie de 2 km². Classement
- Les villes voisines les plus proches sont Le Vésinet, Saint-Germain-en-Laye, Le Port-Marly, Mareil-Marly et Louveciennes

Mairie de Le Pecq
Mme Anne-Laure DEBROSSES
Maire de Le Pecq
Maire de Le Pecq
Adresse
13 bis quai Maurice-Berteaux 78231 Le PecqContact
Heures d'ouvertures
Lundi : 08:30-12:00 13:30-17:00Mardi : 08:30-12:00 13:30-17:00
Mercredi : 08:30-12:00 13:30-17:00
Jeudi : 08:30-12:00 13:30-17:00
Vendredi : 08:30-12:00 13:30-17:00
Samedi : 08:30-12:00
Dimanche : Fermé
Photos de Le Pecq
-

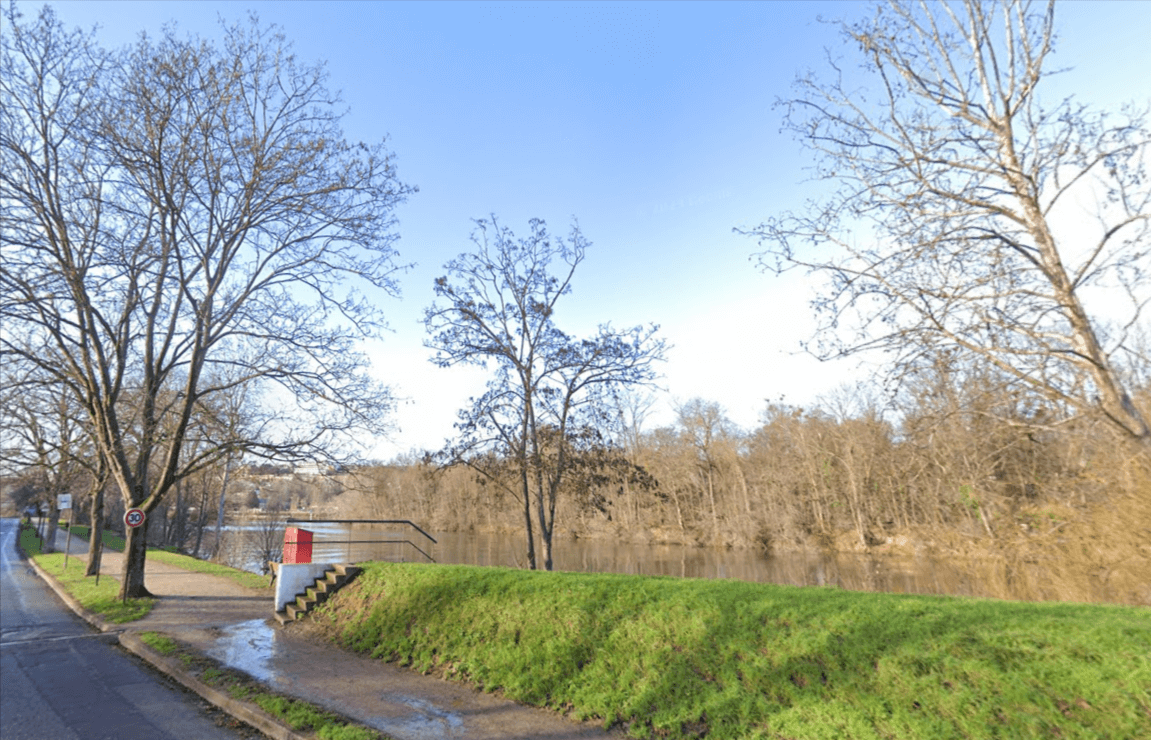
Quais de Seine
Auteur : Claire
-
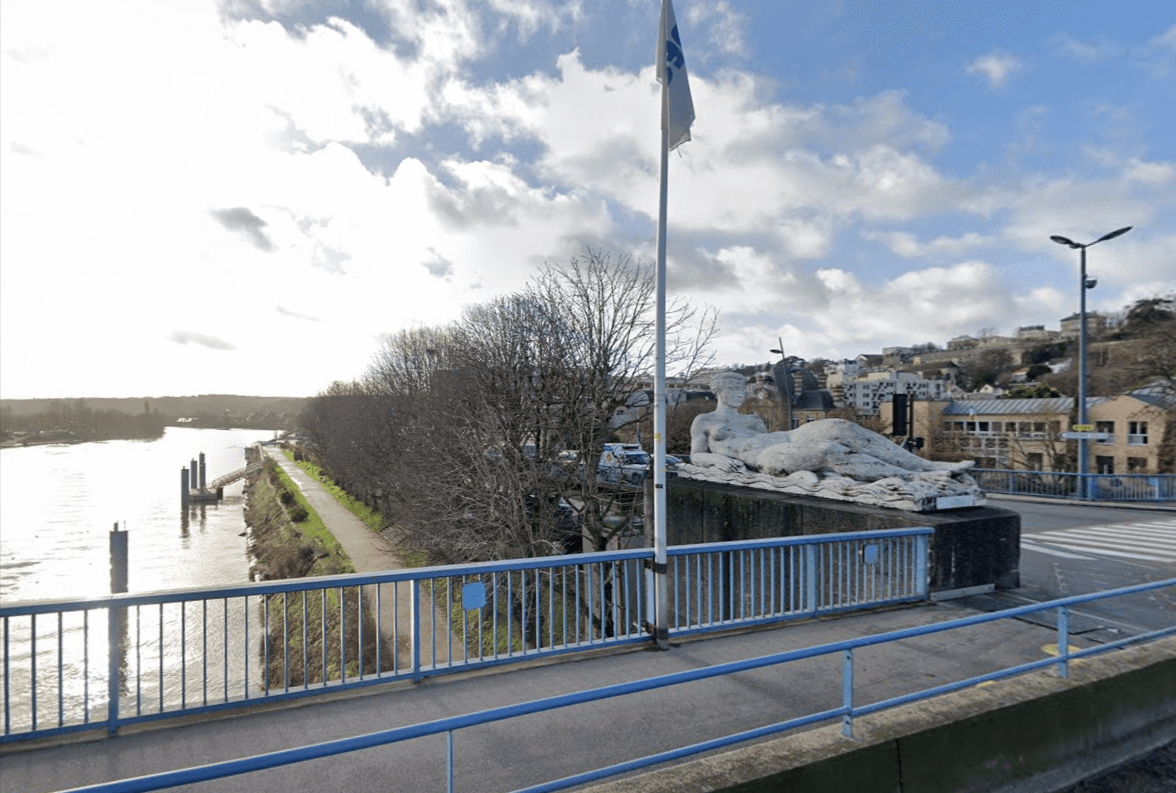
Le Pecq
Auteur : Sophie
-
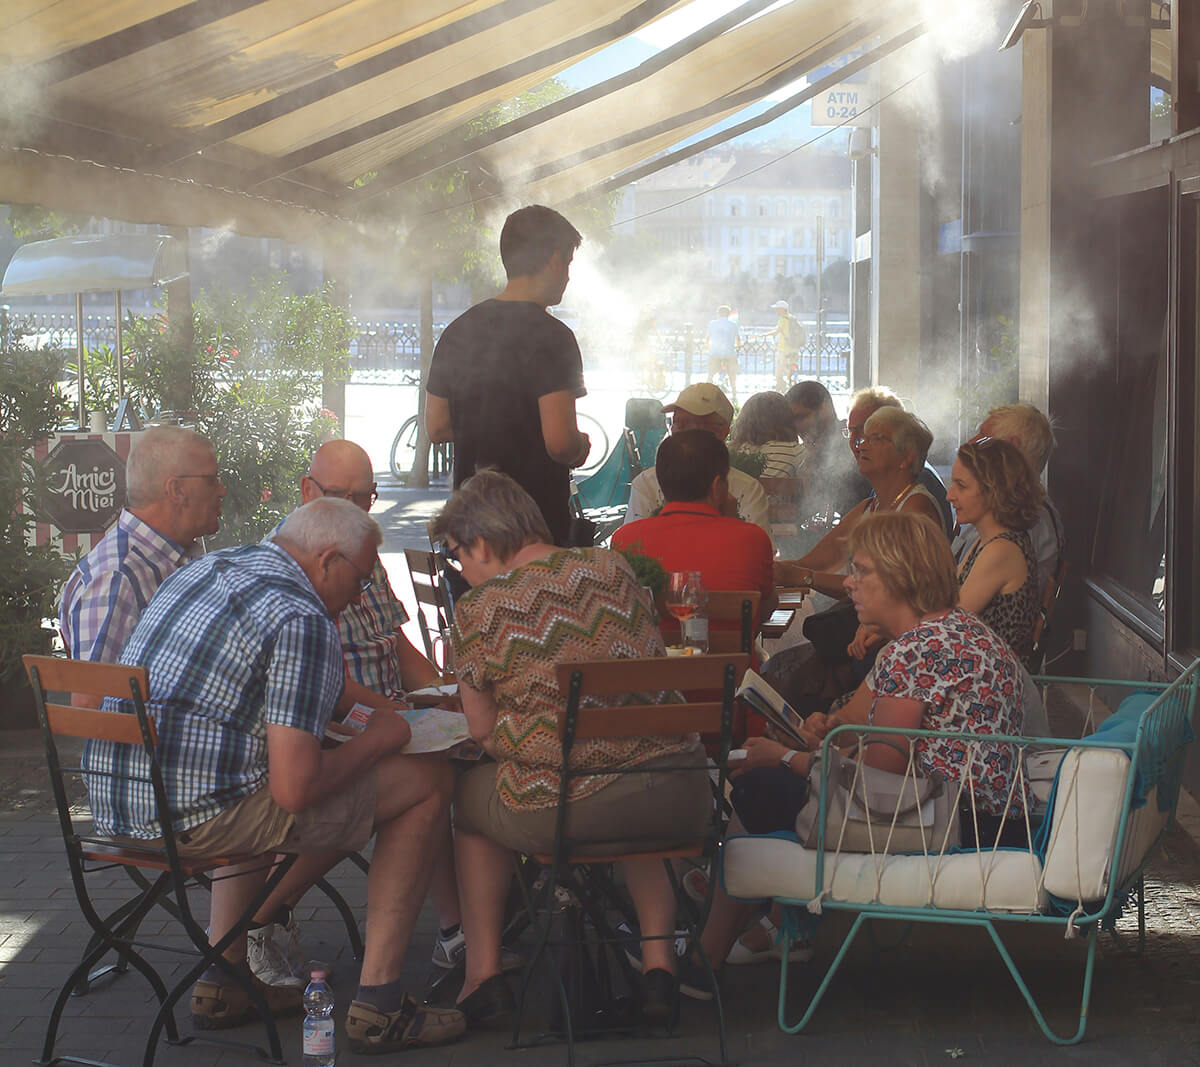
Pont du Pecq
Auteur : Anna
Villes autour de Le Pecq
| Ville | Habitants | Superficie | Pop densité | Pop active | Taux chômage | Revenu moyen | Prix immobilier | Note globale |
|---|---|---|---|---|---|---|---|---|
| Statistiques Le Vésinet | 15 554 | 5 km² | 3 111 h/km² | 46.6% | 3.4% | 42 870 €/an | 6 431 €/m² | 4.0 |
| Statistiques Saint-Germain-en-Laye | 45 931 | 51 km² | 901 h/km² | 46.1% | 4.5% | 33 250 €/an | 5 952 €/m² | 4.2 |
| Statistiques Le Port-Marly | 5 559 | 1 km² | 5 559 h/km² | 53.4% | 6.4% | 26 620 €/an | 4 214 €/m² | 4.3 |
| Statistiques Mareil-Marly | 4 141 | 1 km² | 4 141 h/km² | 43.5% | 2.9% | 40 010 €/an | 4 676 €/m² | 3.8 |
| Statistiques Louveciennes | 7 990 | 5 km² | 1 598 h/km² | 40.1% | 4.1% | 36 060 €/an | 4 571 €/m² | 2.9 |
| Statistiques Marly-le-Roi | 16 756 | 6 km² | 2 793 h/km² | 47.9% | 4% | 31 270 €/an | 4 114 €/m² | 3.9 |
| Statistiques Montesson | 14 549 | 7 km² | 2 078 h/km² | 50.2% | 3.7% | 32 980 €/an | 4 555 €/m² | 3.7 |
| Statistiques Chatou | 30 598 | 5 km² | 6 120 h/km² | 48.4% | 3.9% | 33 670 €/an | 5 230 €/m² | 3.7 |
| Statistiques L'Étang-la-Ville | 5 157 | 5 km² | 1 031 h/km² | 42.6% | 3.1% | 40 580 €/an | 4 873 €/m² | 3.5 |
| Statistiques Bougival | 9 134 | 2 km² | 4 567 h/km² | 52% | 4.3% | 31 630 €/an | 4 885 €/m² | 2.6 |
| Statistiques Croissy-sur-Seine | 11 013 | 3 km² | 3 671 h/km² | 44.6% | 3.2% | 38 780 €/an | 5 999 €/m² | 3.7 |
| Statistiques Le Mesnil-le-Roi | 6 332 | 3 km² | 2 111 h/km² | 46.8% | 3.4% | 36 120 €/an | 4 993 €/m² | 4.0 |
| Statistiques Chambourcy | 5 847 | 7 km² | 835 h/km² | 45.7% | 3.7% | 32 930 €/an | 4 039 €/m² | 4.0 |
| Statistiques Poissy | 40 983 | 13 km² | 3 153 h/km² | 46.9% | 6% | 23 910 €/an | 3 740 €/m² | 3.7 |
| Statistiques Bailly | 3 731 | 6 km² | 622 h/km² | 41.9% | 3.1% | 38 230 €/an | 4 241 €/m² | 4.4 |
Articles en relation
Acteur de l'économie locale :Faites découvrir vos services à Le Pecq


Signalement de photo
Merci ! Votre signalement est envoyé !
Ajouter une photo de Le Pecq
Merci ! Votre photo sera diffusée sur le site après modération.