


Signalement de photo
Merci ! Votre signalement est envoyé !
Quel est le nombre d'habitants à Nouzilly ? Dans quel département et dans quelle région se situe la ville ? Quelle est sa superficie ?
Quels sont les chiffres de la délinquance ?
Découvrez sur cette page toutes les informations essentielles sur la population, la sécurité, les services et l'immobilier à Nouzilly.
NOUVEAU : Rues sales, dépôts sauvages, dégradations urbaines. Faites votre signalement anonyme, nous nous chargeons de prévenir les autorités compétentes.
| Nombre d'habitants | 1 237 | Classement |
| Age moyen | 41 ans | Classement |
| Pop active | 52.7% | Classement |
| Taux chômage | 4.7% | Classement |
| Pop densité | 31 h/km² | Classement |
| Revenu moyen | 25 390 €/an | Classement |
| Agressions physiques / sexuelles | 0 |
| Cambriolages | 0 |
| Vols / dégradations | 0 |
| Stupéfiants | 0 |
Achat / Vente / Location Votre agence immobilière à Nouzilly
| Prix moyen | 133 874 € | Prix moyen au m² | 1 463 € |
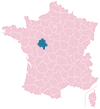
Carte de la ville de Nouzilly

Commerce |
|
|---|---|
|
Hypermarché (13km) Château-Renault |
|
|
Supermarché (6km) Monnaie |
|
| Boulangerie | 1 |
|
Boucherie (10km) Chanceaux-sur-Choisille |
|
|
Station-service (6km) Monnaie |
|
|
Banque (6km) Monnaie |
|
|
La poste (6km) Monnaie |
|
| Coiffeur | 1 |
|
Vétérinaire (6km) Monnaie |
|
| Restaurant | 1 |
Santé |
|
|---|---|
|
Médecin (4km) Saint-Laurent-en-Gâtines |
|
|
Dentiste (6km) Monnaie |
|
| Pharmacie | 1 |
Éducation |
|
|---|---|
| Maternelle | 1 |
| Primaire | 1 |
|
Collège (13km) Neuvy-le-Roi |
|
|
Lycée (13km) Château-Renault |
|


NOUVEAU : Décharges sauvages, détritus, objets abandonnés, graffitis, nids-de-poule : Déclarer un incident à Nouzilly


 Emmanuel MACRON
 Marine LE PEN
 Jean-Luc MÉLENCHON
 Éric ZEMMOUR
 Yannick JADOT
 Jean LASSALLE
 Valérie PÉCRESSE
 Nicolas DUPONT-AIGNAN
 Anne HIDALGO
 Philippe POUTOU
 Nathalie ARTHAUD
 Fabien ROUSSELEmmanuel MACRONMarine LE PEN
| Ville | Habitants | Superficie | Pop densité | Pop active | Taux chômage | Revenu moyen | Prix immobilier | Note globale |
|---|---|---|---|---|---|---|---|---|
| Statistiques Saint-Laurent-en-Gâtines | 896 | 32 km² | 28 h/km² | 49.7% | 2.8% | 23 120 €/an | 1 430 €/m² | - |
| Statistiques Monnaie | 4 737 | 39 km² | 121 h/km² | 50.6% | 3.2% | 24 360 €/an | 2 016 €/m² | 2.7 |
| Statistiques Crotelles | 653 | 16 km² | 41 h/km² | 50.7% | 3.4% | 23 830 €/an | 1 800 €/m² | - |
| Statistiques Beaumont-Louestault | 1 765 | 55 km² | 32 h/km² | 52.2% | 2.9% | 24 140 €/an | 1 823 €/m² | - |
| Statistiques Cerelles | 1 242 | 12 km² | 104 h/km² | 52.3% | 3.5% | 26 800 €/an | 1 882 €/m² | 5.0 |
| Statistiques Rouziers-de-Touraine | 1 348 | 18 km² | 75 h/km² | 51.1% | 3.3% | 24 680 €/an | 1 944 €/m² | 5.0 |
| Statistiques La Ferrière | 318 | 16 km² | 20 h/km² | 50.3% | 4.7% | 23 320 €/an | 1 242 €/m² | 4.4 |
| Statistiques Marray | 482 | 24 km² | 20 h/km² | 51.9% | 5% | 23 780 €/an | 1 906 €/m² | - |
| Statistiques Chanceaux-sur-Choisille | 3 519 | 18 km² | 196 h/km² | 49% | 3.8% | 25 710 €/an | 2 342 €/m² | 3.4 |
| Statistiques Villedômer | 1 310 | 35 km² | 37 h/km² | 46.2% | 4.4% | 23 540 €/an | 1 434 €/m² | 4.2 |
| Statistiques Teillé | 1 812 | 29 km² | 62 h/km² | 47.8% | 3.4% | 22 280 €/an | 1 479 €/m² | 3.4 |
| Statistiques Le Boulay | 795 | 20 km² | 40 h/km² | 47.4% | 3.5% | 22 720 €/an | 1 569 €/m² | 4.0 |
| Statistiques Saint-Antoine-du-Rocher | 1 770 | 24 km² | 74 h/km² | 47.8% | 2.7% | 26 050 €/an | 1 858 €/m² | 5.0 |
| Statistiques Notre-Dame-d'Oé | 4 191 | 8 km² | 524 h/km² | 46.6% | 3.4% | 25 460 €/an | 2 264 €/m² | 3.6 |
| Statistiques Reugny | 1 760 | 30 km² | 59 h/km² | 50.2% | 3.3% | 23 690 €/an | 1 722 €/m² | 4.2 |