


Signalement de photo
Merci ! Votre signalement est envoyé !
Quel est le nombre d'habitants à Morthomiers ? Dans quel département et dans quelle région se situe la ville ? Quelle est sa superficie ?
Quels sont les chiffres de la délinquance ?
Découvrez sur cette page toutes les informations essentielles sur la population, la sécurité, les services et l'immobilier à Morthomiers.
NOUVEAU : Rues sales, dépôts sauvages, dégradations urbaines. Faites votre signalement anonyme, nous nous chargeons de prévenir les autorités compétentes.
| Nombre d'habitants | 790 | Classement |
| Age moyen | 38 ans | Classement |
| Pop active | 53.9% | Classement |
| Taux chômage | 4.1% | Classement |
| Pop densité | 53 h/km² | Classement |
| Revenu moyen | 24 200 €/an | Classement |
| Agressions physiques / sexuelles | 0 |
| Cambriolages | 0 |
| Vols / dégradations | 0 |
| Stupéfiants | 0 |
Achat / Vente / Location Votre agence immobilière à Morthomiers
| Prix moyen | 104 999 € | Prix moyen au m² | 1 135 € |
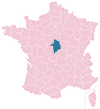
Carte de la ville de Morthomiers

Commerce |
|
|---|---|
|
Hypermarché (10km) Saint-Doulchard |
|
|
Supermarché (5km) La Chapelle-Saint-Ursin |
|
|
Boulangerie (5km) La Chapelle-Saint-Ursin |
|
|
Boucherie (6km) Saint-Florent-sur-Cher |
|
|
Station-service (5km) La Chapelle-Saint-Ursin |
|
|
Banque (5km) La Chapelle-Saint-Ursin |
|
|
La poste (5km) La Chapelle-Saint-Ursin |
|
| Coiffeur | 1 |
|
Vétérinaire (6km) Saint-Florent-sur-Cher |
|
| Restaurant | 1 |
Santé |
|
|---|---|
|
Médecin (5km) La Chapelle-Saint-Ursin |
|
|
Dentiste (5km) La Chapelle-Saint-Ursin |
|
|
Pharmacie (5km) La Chapelle-Saint-Ursin |
|
Éducation |
|
|---|---|
| Maternelle | 1 |
| Primaire | 1 |
|
Collège (6km) Saint-Florent-sur-Cher |
|
|
Lycée (3km) Le Subdray |
|


NOUVEAU : Décharges sauvages, détritus, objets abandonnés, graffitis, nids-de-poule : Déclarer un incident à Morthomiers


 Marine LE PEN
 Emmanuel MACRON
 Jean-Luc MÉLENCHON
 Yannick JADOT
 Jean LASSALLE
 Éric ZEMMOUR
 Fabien ROUSSEL
 Valérie PÉCRESSE
 Nicolas DUPONT-AIGNAN
 Anne HIDALGO
 Nathalie ARTHAUD
 Philippe POUTOUEmmanuel MACRONMarine LE PEN
| Ville | Habitants | Superficie | Pop densité | Pop active | Taux chômage | Revenu moyen | Prix immobilier | Note globale |
|---|---|---|---|---|---|---|---|---|
| Statistiques Le Subdray | 979 | 20 km² | 49 h/km² | 47.9% | 2.6% | 28 990 €/an | 1 594 €/m² | - |
| Statistiques Villeneuve-sur-Cher | 406 | 26 km² | 16 h/km² | 44.3% | 5.2% | 23 630 €/an | 1 018 €/m² | - |
| Statistiques La Chapelle-Saint-Ursin | 3 692 | 8 km² | 462 h/km² | 46.9% | 4.1% | 25 430 €/an | 1 524 €/m² | 4.1 |
| Statistiques Saint-Florent-sur-Cher | 6 419 | 22 km² | 292 h/km² | 41.5% | 5.5% | 21 260 €/an | 1 118 €/m² | 3.0 |
| Statistiques Trouy | 4 005 | 23 km² | 174 h/km² | 46.9% | 2.4% | 25 760 €/an | 1 429 €/m² | - |
| Statistiques Sainte-Thorette | 475 | 27 km² | 18 h/km² | 49.7% | 4% | 23 390 €/an | 1 030 €/m² | 3.6 |
| Statistiques Marmagne | 1 905 | 38 km² | 50 h/km² | 48.7% | 3.2% | 25 700 €/an | 1 660 €/m² | 3.4 |
| Statistiques Saint-Caprais | 768 | 14 km² | 55 h/km² | 54.8% | 4% | 25 210 €/an | 1 608 €/m² | - |
| Statistiques Berry-Bouy | 1 168 | 31 km² | 38 h/km² | 48.5% | 3.1% | 25 920 €/an | 1 675 €/m² | - |
| Statistiques Saint-Doulchard | 9 645 | 24 km² | 402 h/km² | 41.4% | 4.2% | 25 210 €/an | 1 651 €/m² | 3.7 |
| Statistiques Preuilly | 456 | 15 km² | 30 h/km² | 49.1% | 2.2% | 23 960 €/an | 1 424 €/m² | - |
| Statistiques Plou | 539 | 33 km² | 16 h/km² | 49.5% | 3.2% | 24 940 €/an | 1 546 €/m² | - |
| Statistiques Civray | 909 | 41 km² | 22 h/km² | 49.8% | 4.3% | 23 380 €/an | 981 €/m² | 4.0 |
| Statistiques Lunery | 1 558 | 33 km² | 47 h/km² | 44.5% | 7.1% | 21 130 €/an | 1 074 €/m² | - |
| Statistiques Arçay | 487 | 18 km² | 27 h/km² | 52.2% | 3.3% | 24 760 €/an | 1 175 €/m² | - |