
Bienvenue à Mison, ville du département des Alpes-de-Haute-Provence en région Provence-Alpes-Côte d'Azur. Comptabilisant aujourd'hui 1 112 habitants, la ville évolue en s'adaptant aux réalités de son territoire et aux besoins de sa population sous la gestion de son maire Robert GAY.
Présentation
Statistiques sur la population
Quel est le profil de la population, sa situation démographique ?
| Nombre d'habitants | 1 112 | Classement |
|---|---|---|
| Age moyen | 46 ans | Classement |
| Pop active | 45.4% | Classement |
| Taux chômage | 9.2% | Classement |
| Pop densité | 36 h/km² | Classement |
| Revenu moyen | 22 860 €/an | Classement |
Evolution du nombre d'habitants
Aujourd'hui, en 2026, la population de Mison est estimée à 1 125 habitants selon un modèle de régression linéaire appliqué aux dix dernières années. (1 123 en 2025).
Les derniers chiffres officiels publiés par la source INSEE en 2026 portent sur la population de 2023 qui enregistre une baisse de 0.3% sur un an.
Les derniers chiffres officiels publiés par la source INSEE en 2026 portent sur la population de 2023 qui enregistre une baisse de 0.3% sur un an.
Tranche d'âge


0-14 ans
15%

15-29 ans
12%

30-44 ans
16%

45-59 ans
23%

60-74 ans
26%

75-89 ans
8%

90 ans et +
1%
Activité professionnelle


Agriculteurs
2%

Artisans, Commerçants
5%

Cadres et sup.
4%

Professions intermédiaires
15%

Employé
12%

Ouvrier
12%

Retraité
23%

Autres
11%
Niveau de diplôme


Sans diplôme ou CEP
15%

Brevet, BEPC, DNB
5%

CAP-BEP ou équivalent
36%

BAC ou équivalent
19%

BAC+2
11%

BAC+3 ou +4
8%

BAC+5 ou plus
5%
Composition des ménages


Couple sans enfant
46%

Couple avec enfant(s)
27%

Famille monoparentale
5%

Colocation / Autre
2%

Personnes seules
20%
Profils électoraux
Quels sont les résultats des dernières élections aux présidentiels 2022 ?
Premier tour
 Marine LE PEN
30.40 %
 Emmanuel MACRON
20.91 %
 Jean-Luc MÉLENCHON
19.53 %
 Éric ZEMMOUR
8.25 %
 Jean LASSALLE
4.68 %
 Valérie PÉCRESSE
4.68 %
 Yannick JADOT
4.26 %
 Fabien ROUSSEL
2.48 %
 Nicolas DUPONT-AIGNAN
1.51 %
 Anne HIDALGO
1.38 %
 Philippe POUTOU
1.38 %
 Nathalie ARTHAUD
0.55 %
927 inscrits
Participation : 79.4%
Votes blancs : 0.95%
Votes nuls : 0.27%
Participation : 79.4%
Votes blancs : 0.95%
Votes nuls : 0.27%
Second tour
Emmanuel MACRON41,32 %
Marine LE PEN58,68 %
928 inscrits
Participation : 78.56%
Votes blancs : 8.64%
Votes nuls : 2.06%
Participation : 78.56%
Votes blancs : 8.64%
Votes nuls : 2.06%
Bon à savoir :
- Le revenu moyen par habitant à Mison (22 860 €) est au dessus de la moyenne nationale (20 590 €).
- La part de la population au chômage (9.2%) est supérieure à la moyenne nationale (8%).
- Le taux de chômage indiqué est au sens du BIT qui se distingue du taux de chômage au sens du recensement de la population.
Sources : Institut national de la statistique et des études économiques (insee) selon Les dernières parutions officielles de 2025 portant sur les années 2020, 2021 et 2022.
Sécurité, faits divers : les chiffres de la délinquance
| Agressions physiques / sexuelles | 0 |
|---|---|
| Cambriolages | 0 |
| Vols / dégradations | 9 |
| Stupéfiants | 0 |
Evolution du nombre d'infractions
Pour comparer(en proportion du nombre d'habitants)
La ville
Sources : Bases statistiques communale, départementale et régionale de la délinquance enregistrée par la police et la gendarmerie nationales selon les dernières parutions officielles de 2026 portant sur l'année 2025 (data.gouv).
Agressions physiques / sexuelles : Violences sexuelles, coups et blessures volontaires intrafamiliaux, coups et blessures volontaires, autres coups, blessures volontaires et vols violents sans arme.
Cambriolages : Cambriolages de logements.
Vols : Vols avec armes, vols d'accessoires sur véhicules, vols dans les véhicules, vols de véhicules, vols sans violence contre des personnes, destructions, dégradations volontaires et escroqueries.
Stupéfiants : Trafic de stupéfiants dont (AFD) et usage de stupéfiants.
Services à la population
Commerce |
|
|---|---|
|
Hypermarché Sisteron 7km |
|
|
Supermarché Laragne-Montéglin 5km |
|
| Supérette | 3 |
| Boulangerie | 1 |
|
Boucherie Val Buëch-Méouge 4km |
|
| Restaurant | 2 |
| Garage | 4 |
|
Station-service Laragne-Montéglin 6km |
|
|
Banque Laragne-Montéglin 5km |
|
|
La poste Laragne-Montéglin 5km |
|
| Coiffeur | 2 |
|
Tabac Val Buëch-Méouge 4km |
|
|
Bars / discothèque Val Buëch-Méouge 2km |
|
|
Bibliothèque Ongles 28km |
|
|
Cinéma Laragne-Montéglin 5km |
|
|
Vétérinaire Laragne-Montéglin 5km |
|
Santé |
|
|---|---|
|
Pharmacie Laragne-Montéglin 5km |
|
|
Hôpital Laragne-Montéglin 5km |
|
|
Laboratoire d'analyses médicales Laragne-Montéglin 5km |
|
|
Etablissement pour handicapé Laragne-Montéglin 6km |
|
|
EHPA Laragne-Montéglin 5km |
|
|
Médecin Laragne-Montéglin 5km |
|
|
Dentiste Laragne-Montéglin 5km |
|
|
Chirurgien Volonne 22km |
|
|
Dermatologue Tallard 28km |
|
|
Anesthésiste Gap 38km |
|
|
Gastro-entérologue Digne-les-Bains 35km |
|
|
Gynécologue Digne-les-Bains 35km |
|
|
Cancérologue Manosque 48km |
|
|
Neurologue Gap 38km |
|
|
Ophtalmologue La Saulce 22km |
|
|
ORL Sisteron 12km |
|
|
Cardiologue Sisteron 12km |
|
|
Pédiatre Forcalquier 35km |
|
|
Pneumologue Oraison 40km |
|
|
Psychologue Sisteron 12km |
|
|
Radiologue Gap 37km |
|
|
Rhumatologue Sisteron 7km |
|
|
Sage-femme Noyers-sur-Jabron 11km |
|
Éducation |
|
|---|---|
|
Crèche Val Buëch-Méouge 2km |
|
|
Ecole maternelle Public Vaumeilh 10km |
|
|
Ecole maternelle Privé Vaison-la-Romaine 59km |
|
| Ecole primaire Public | 1 |
|
Ecole primaire Privé Valernes 10km |
|
|
Collège Public Laragne-Montéglin 6km |
|
|
Collège Privé Noyers-sur-Jabron 10km |
|
|
Lycée Public Sisteron 13km |
|
|
Lycée Privé Digne-les-Bains 38km |
|
Bon à savoir :
- La ville ne possède pas de grands magasins alimentaire.
- La ville ne compte aucun médecin.
Sources : Base Sirene des entreprises et de leurs établissements selon les dernières parutions officielles de 2025 portant sur l'année 2024 (data.gouv). Liste, localisation et tarifs des professionnels de santé selon les dernières parutions officielles de 2025 portant sur l'année 2024 (opendatasoft) et FINESS Extraction du Fichier des établissements selon les dernières parutions officielles de 2025 portant sur l'année 2024 (data.gouv). Adresse et géolocalisation des établissements d'enseignement du premier et second degrés selon les dernières parutions officielles de 2025 portant sur l'année 2024 (data.education.gouv)
Carte et superficie
Carte de la ville de Mison
Bon à savoir :
- Mison est rattachée aux collectivités territoriales de la région Provence-Alpes-Côte d'Azur, du département Alpes-de-Haute-Provence
- Le code postal de Mison est 04200.
- Mison s'étend sur une superficie de 31 km². Classement
- Les villes voisines les plus proches sont Val Buëch-Méouge, Le Poët, Laragne-Montéglin, Saint-Pierre-Avez et Upaix

Mairie de Mison
M. Robert GAY
Maire de Mison
Maire de Mison
Adresse
Place Ernest-Esclangon Les Armands 04200 MisonContact
Heures d'ouvertures
Lundi : 09:00-12:00Mardi : 09:00-12:00 16:00-19:00
Mercredi : 08:00-12:00
Jeudi : 09:00-12:00
Vendredi : 08:00-12:00
Samedi : Fermé
Dimanche : Fermé
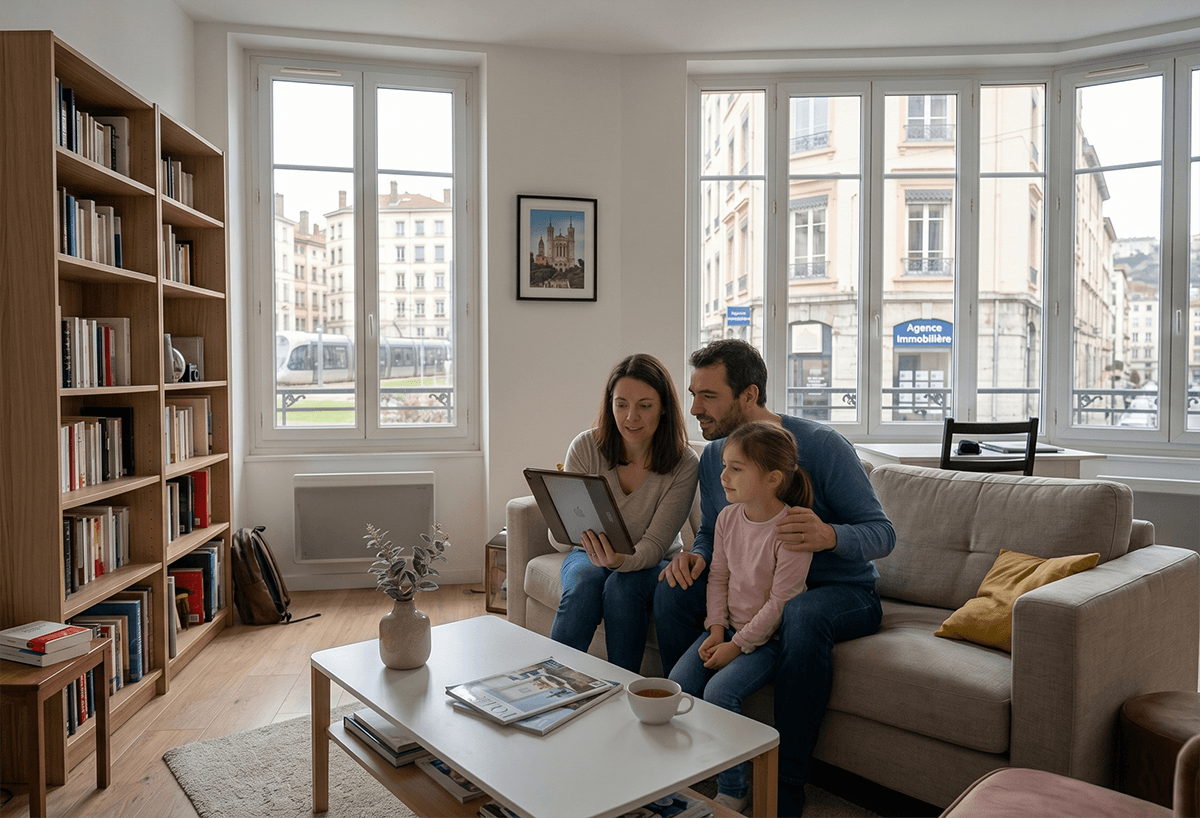
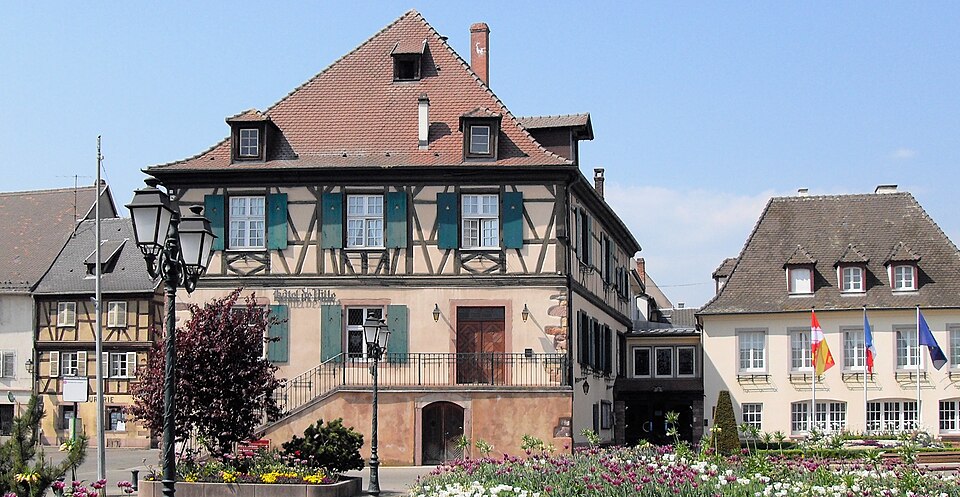
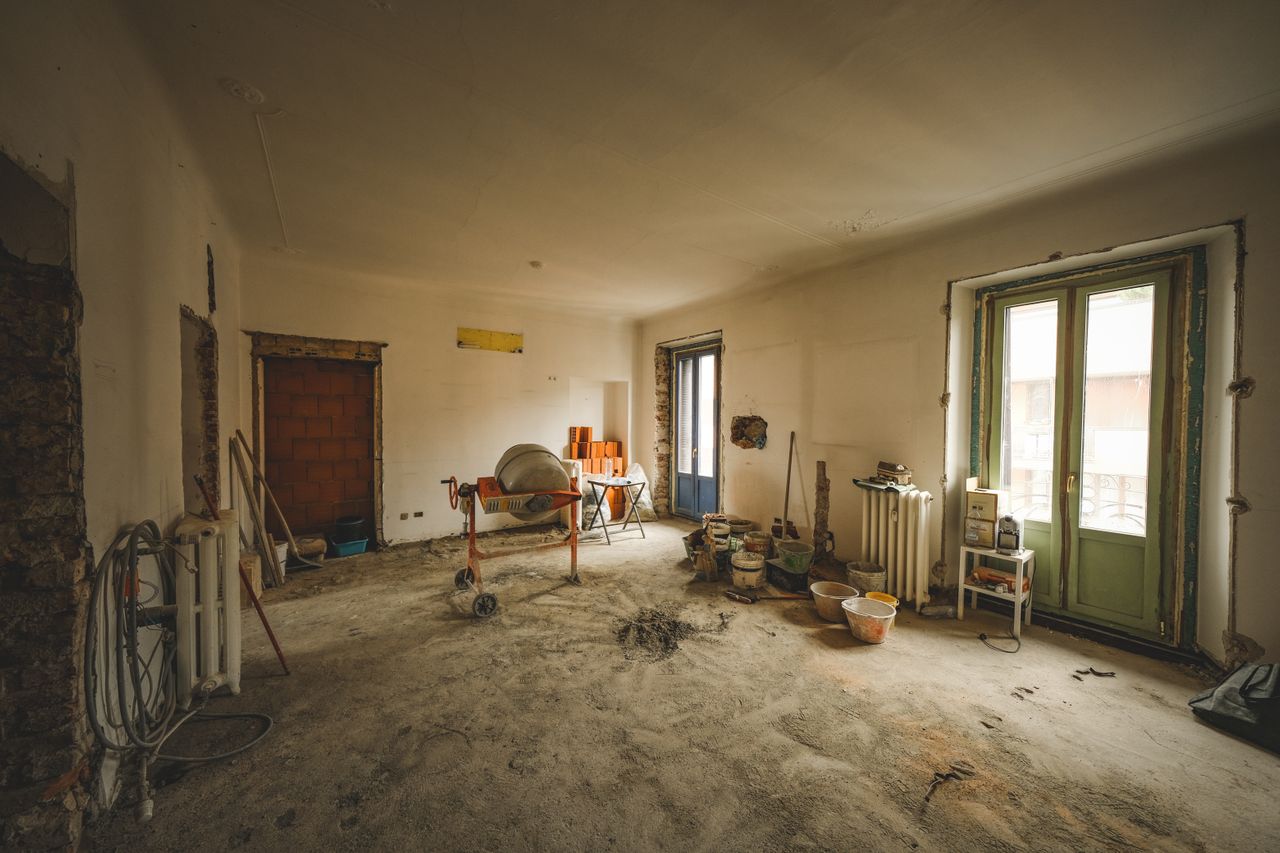
Photos de Mison

Signalements urbains
Les actes d'incivilités envahissent nos rues, agissons ! Un follow instagram = Un soutien
NOUVEAU : Décharges sauvages, détritus, objets abandonnés, graffitis, nids-de-poule : Déclarer un incident à Mison


Villes autour de Mison
| Ville | Habitants | Superficie | Pop densité | Pop active | Taux chômage | Revenu moyen | Prix immobilier | Note globale |
|---|---|---|---|---|---|---|---|---|
| Statistiques Val Buëch-Méouge | 1 354 | 68 km² | 20 h/km² | 40.5% | 3.9% | 22 300 €/an | 1 491 €/m² | - |
| Statistiques Le Poët | 790 | 15 km² | 53 h/km² | 45.7% | 4.7% | 22 380 €/an | 1 864 €/m² | - |
| Statistiques Laragne-Montéglin | 3 549 | 23 km² | 154 h/km² | 38.9% | 5.9% | 21 080 €/an | 1 415 €/m² | 3.1 |
| Statistiques Saint-Pierre-Avez | 35 | 11 km² | 3 h/km² | 51.4% | 11.4% | NC | 594 €/m² | - |
| Statistiques Upaix | 494 | 23 km² | 21 h/km² | 39.1% | 2% | 21 970 €/an | 1 593 €/m² | - |
| Statistiques Barret-sur-Méouge | 193 | 26 km² | 7 h/km² | 32.6% | 7.8% | 18 300 €/an | 962 €/m² | - |
| Statistiques Nossage-et-Bénévent | 10 | 4 km² | 3 h/km² | 80% | 0% | NC | NC | - |
| Statistiques Thèze | 268 | 11 km² | 24 h/km² | 40.7% | 4.1% | 19 870 €/an | 2 398 €/m² | - |
| Statistiques Lazer | 345 | 22 km² | 16 h/km² | 50.1% | 5.5% | 23 300 €/an | 2 000 €/m² | - |
| Statistiques Vaumeilh | 270 | 25 km² | 11 h/km² | 52.6% | 4.8% | 18 090 €/an | 1 378 €/m² | - |
| Statistiques Garde-Colombe | 539 | 34 km² | 16 h/km² | 38.4% | 5.9% | 21 380 €/an | 1 974 €/m² | - |
| Statistiques Valernes | 245 | 28 km² | 9 h/km² | 46.5% | 3.7% | 20 580 €/an | 1 758 €/m² | - |
| Statistiques Saléon | 79 | 9 km² | 9 h/km² | 55.7% | 8.9% | NC | 1 364 €/m² | - |
| Statistiques Bevons | 260 | 11 km² | 24 h/km² | 45.8% | 4.2% | 25 170 €/an | 1 861 €/m² | 5.0 |
| Statistiques Salérans | 78 | 13 km² | 6 h/km² | 39.7% | 5.1% | NC | 2 600 €/m² | - |
Articles en relation
Acteur de l'économie locale :Faites découvrir vos services à Mison

Signalement de photo
Merci ! Votre signalement est envoyé !
Ajouter une photo de Mison
Merci ! Votre photo sera diffusée sur le site après modération.