
Bienvenue à Clichy, ville du département des Hauts-de-Seine en région Île-de-France. Comptabilisant aujourd'hui 64 410 habitants, la ville évolue en s'adaptant aux réalités de son territoire et aux besoins de sa population sous la gestion de son maire Rémi MUZEAU.
Présentation

Statistiques sur la population
Quel est le profil de la population, sa situation démographique ?
| Nombre d'habitants | 64 410 | Classement |
|---|---|---|
| Age moyen | 37 ans | Classement |
| Pop active | 54.9% | Classement |
| Taux chômage | 9.9% | Classement |
| Pop densité | 21 470 h/km² | Classement |
| Revenu moyen | 22 410 €/an | Classement |
Evolution du nombre d'habitants
Aujourd'hui, en 2026, la population de Clichy est estimée à 67 128 habitants selon un modèle de régression linéaire appliqué aux dix dernières années. (66 505 en 2025).
Les derniers chiffres officiels publiés par la source INSEE en 2026 portent sur la population de 2023 qui enregistre une baisse de 1.1% sur un an.
Les derniers chiffres officiels publiés par la source INSEE en 2026 portent sur la population de 2023 qui enregistre une baisse de 1.1% sur un an.
Tranche d'âge


0-14 ans
18%

15-29 ans
21%

30-44 ans
24%

45-59 ans
18%

60-74 ans
12%

75-89 ans
4%

90 ans et +
1%
Activité professionnelle


Agriculteurs
0%

Artisans, Commerçants
2%

Cadres et sup.
16%

Professions intermédiaires
13%

Employé
15%

Ouvrier
6%

Retraité
12%

Autres
15%
Niveau de diplôme


Sans diplôme ou CEP
22%

Brevet, BEPC, DNB
4%

CAP-BEP ou équivalent
13%

BAC ou équivalent
15%

BAC+2
10%

BAC+3 ou +4
12%

BAC+5 ou plus
23%
Composition des ménages


Couple sans enfant
23%

Couple avec enfant(s)
32%

Famille monoparentale
9%

Colocation / Autre
7%

Personnes seules
30%
Profils électoraux
Quels sont les résultats des dernières élections aux présidentiels 2022 ?
Premier tour
 Jean-Luc MÉLENCHON
42.15 %
 Emmanuel MACRON
28.77 %
 Marine LE PEN
7.19 %
 Yannick JADOT
6.17 %
 Éric ZEMMOUR
5.06 %
 Valérie PÉCRESSE
4.04 %
 Fabien ROUSSEL
1.70 %
 Anne HIDALGO
1.45 %
 Jean LASSALLE
1.21 %
 Nicolas DUPONT-AIGNAN
1.14 %
 Philippe POUTOU
0.65 %
 Nathalie ARTHAUD
0.47 %
31 899 inscrits
Participation : 75.7%
Votes blancs : 1.25%
Votes nuls : 0.53%
Participation : 75.7%
Votes blancs : 1.25%
Votes nuls : 0.53%
Second tour
Emmanuel MACRON82,35 %
Marine LE PEN17,65 %
31 900 inscrits
Participation : 69.48%
Votes blancs : 6.36%
Votes nuls : 1.72%
Participation : 69.48%
Votes blancs : 6.36%
Votes nuls : 1.72%
Bon à savoir :
- Le revenu moyen par habitant à Clichy (22 410 €) est au dessus de la moyenne nationale (20 590 €).
- La part de la population au chômage (9.9%) est supérieure à la moyenne nationale (8%).
- Le taux de chômage indiqué est au sens du BIT qui se distingue du taux de chômage au sens du recensement de la population.
Sources : Institut national de la statistique et des études économiques (insee) selon Les dernières parutions officielles de 2025 portant sur les années 2020, 2021 et 2022.
Sécurité, faits divers : les chiffres de la délinquance
| Agressions physiques / sexuelles | 536 |
|---|---|
| Cambriolages | 89 |
| Vols / dégradations | 2 528 |
| Stupéfiants | 499 |
Evolution du nombre d'infractions
Pour comparer(en proportion du nombre d'habitants)
La ville
Bilan sécurité 2025 : la ville de Clichy est-elle sûre ?
L'examen des indices de criminalité à Clichy pour l'année 2025 révèle une situation favorable. Le climat sécuritaire y est serein, avec des indicateurs de délinquance majoritairement inférieurs aux moyennes nationales.
- Atteintes à l'intégrité physique : Concernant les atteintes à l'intégrité physique, la ville affiche un bilan positif avec un taux d'agressions et de violences volontaires nettement inférieur aux seuils nationaux.
- Cambriolages : La protection des domiciles est efficace : le taux de cambriolages de logements reste très inférieur à la moyenne, limitant l'exposition des résidents à ce risque.
- Vols et dégradations : On note une récurrence des faits de petite délinquance. Les indicateurs de vols et destructions volontaires sont supérieurs à la moyenne, pesant sur le sentiment de sécurité.
- Stupéfiants : La thématique des stupéfiants marque un point de tension : les faits de trafic ou d'usage recensés sont supérieurs aux seuils de référence nationaux.
Sources : Bases statistiques communale, départementale et régionale de la délinquance enregistrée par la police et la gendarmerie nationales selon les dernières parutions officielles de 2026 portant sur l'année 2025 (data.gouv).
Agressions physiques / sexuelles : Violences sexuelles, coups et blessures volontaires intrafamiliaux, coups et blessures volontaires, autres coups, blessures volontaires et vols violents sans arme.
Cambriolages : Cambriolages de logements.
Vols : Vols avec armes, vols d'accessoires sur véhicules, vols dans les véhicules, vols de véhicules, vols sans violence contre des personnes, destructions, dégradations volontaires et escroqueries.
Stupéfiants : Trafic de stupéfiants dont (AFD) et usage de stupéfiants.
Comparatif des quartiers
| Quartier | Habitants | Superficie | Pop densité | Pop active | Taux chômage | Revenu moyen | Note globale |
|---|---|---|---|---|---|---|---|
Bac d'Asnières-Valiton-Fournier |
7 795 | 0.7 km² | 11 136 h/km² | 54% | 6.8% | 15 525 €/an | 3.2 |
Berges de Seine-Beaujon |
11 399 | 0.83 km² | 13 734 h/km² | 50.8% | 8.7% | 16 072 €/an | 2.2 |
Centre Ville |
11 138 | 0.41 km² | 27 166 h/km² | 60.1% | 5.9% | 25 253 €/an | 3.5 |
Entree de Ville |
10 902 | 0.43 km² | 25 353 h/km² | 54.4% | 6.5% | 22 988 €/an | 3.3 |
Moreuil-Gambetta |
7 617 | 0.22 km² | 34 623 h/km² | 53.8% | 5.6% | 27 100 €/an | 2.2 |
Victor Hugo-République |
14 080 | 0.51 km² | 27 608 h/km² | 53.3% | 8.2% | 17 055 €/an | 4.1 |
Services à la population
Commerce |
|
|---|---|
| Hypermarché | 1 |
| Supermarché | 19 |
| Supérette | 61 |
| Boulangerie | 49 |
| Boucherie | 24 |
| Restaurant | 214 |
| Garage | 46 |
| Station-service | 1 |
| Banque | 17 |
| La poste | 702 |
| Coiffeur | 92 |
| Tabac | 5 |
| Bars / discothèque | 46 |
| Bibliothèque | 1 |
|
Cinéma Levallois-Perret 0km |
|
| Vétérinaire | 3 |
Santé |
|
|---|---|
| Pharmacie | 18 |
| Hôpital | 2 |
| Laboratoire d'analyses médicales | 3 |
| Etablissement pour handicapé | 5 |
| EHPA | 3 |
| Médecin | 28 |
| Dentiste | 25 |
| Chirurgien | 2 |
| Dermatologue | 3 |
| Anesthésiste | 1 |
| Gastro-entérologue | 1 |
| Gynécologue | 2 |
|
Cancérologue Neuilly-sur-Seine 2km |
|
|
Neurologue Levallois-Perret 1km |
|
| Ophtalmologue | 4 |
| ORL | 3 |
| Cardiologue | 1 |
| Pédiatre | 1 |
|
Pneumologue Paris 2km |
|
| Psychologue | 3 |
|
Radiologue Levallois-Perret 1km |
|
|
Rhumatologue Levallois-Perret 1km |
|
| Sage-femme | 4 |
Éducation |
|
|---|---|
| Crèche | 89 |
| Ecole maternelle Public | 9 |
| Ecole maternelle Privé | 2 |
| Ecole primaire Public | 11 |
| Ecole primaire Privé | 5 |
| Collège Public | 3 |
| Collège Privé | 5 |
| Lycée Public | 2 |
| Lycée Privé | 1 |
Bon à savoir :
- La ville comptabilise de nombreux commerces divers et variés.
- La ville compte 1 médecin pour 2300 habitants.
- La ville dispose de tous les établissements scolaires public de l’école maternelle au lycée.
Sources : Base Sirene des entreprises et de leurs établissements selon les dernières parutions officielles de 2025 portant sur l'année 2024 (data.gouv). Liste, localisation et tarifs des professionnels de santé selon les dernières parutions officielles de 2025 portant sur l'année 2024 (opendatasoft) et FINESS Extraction du Fichier des établissements selon les dernières parutions officielles de 2025 portant sur l'année 2024 (data.gouv). Adresse et géolocalisation des établissements d'enseignement du premier et second degrés selon les dernières parutions officielles de 2025 portant sur l'année 2024 (data.education.gouv)
Carte et superficie
Carte de la ville de Clichy
Bon à savoir :
- Clichy est rattachée aux collectivités territoriales de la région Île-de-France, du département Hauts-de-Seine et de la Métropole du Grand Paris
- Le code postal de Clichy est 92110.
- Clichy s'étend sur une superficie de 3 km². Classement
- Les villes voisines les plus proches sont Levallois-Perret, Asnières-sur-Seine, Saint-Ouen-sur-Seine, Bois-Colombes et Neuilly-sur-Seine

Mairie de Clichy
M. Rémi MUZEAU
Maire de Clichy
Maire de Clichy
Adresse
80 boulevard Jean-Jaurès BP 300 92110 ClichyContact
Heures d'ouvertures
Lundi : 08:00-18:00Mardi : 08:00-18:00
Mercredi : 08:00-18:00
Jeudi : 08:00-18:00
Vendredi : 08:00-18:00
Samedi : 09:00-12:00
Dimanche : Fermé
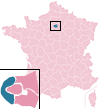
Photos de Clichy
-
L'église Saint-Médard
Auteur : Parisette
Villes autour de Clichy
| Ville | Habitants | Superficie | Pop densité | Pop active | Taux chômage | Revenu moyen | Prix immobilier | Note globale |
|---|---|---|---|---|---|---|---|---|
| Statistiques Levallois-Perret | 68 092 | 2 km² | 34 046 h/km² | 55.2% | 4.7% | 34 500 €/an | 9 093 €/m² | 4.0 |
| Statistiques Asnières-sur-Seine | 93 941 | 4 km² | 23 485 h/km² | 51.9% | 5.1% | 28 370 €/an | 6 340 €/m² | 3.3 |
| Statistiques Saint-Ouen-sur-Seine | 53 615 | 4 km² | 13 404 h/km² | 53.2% | 8.8% | 20 440 €/an | 5 781 €/m² | 3.0 |
| Statistiques Bois-Colombes | 28 909 | 1 km² | 28 909 h/km² | 56.2% | 4.9% | 32 650 €/an | 6 467 €/m² | 3.5 |
| Statistiques Neuilly-sur-Seine | 59 538 | 3 km² | 19 846 h/km² | 46.3% | 4% | 48 010 €/an | 10 306 €/m² | 3.9 |
| Statistiques Courbevoie | 82 902 | 4 km² | 20 726 h/km² | 54.6% | 4.9% | 32 080 €/an | 6 690 €/m² | 3.3 |
| Statistiques La Garenne-Colombes | 30 197 | 1 km² | 30 197 h/km² | 55.8% | 4.2% | 33 090 €/an | 6 583 €/m² | 3.9 |
| Statistiques Gennevilliers | 50 979 | 11 km² | 4 634 h/km² | 45.2% | 8.6% | 18 380 €/an | 4 213 €/m² | 2.6 |
| Statistiques Colombes | 91 053 | 7 km² | 13 008 h/km² | 49.5% | 5.9% | 25 100 €/an | 5 467 €/m² | 3.1 |
| Statistiques L'Île-Saint-Denis | 8 696 | 1 km² | 8 696 h/km² | 46.1% | 7.3% | 17 740 €/an | 3 315 €/m² | 2.6 |
| Statistiques Villeneuve-la-Garenne | 26 021 | 3 km² | 8 674 h/km² | 42.9% | 7.9% | 18 570 €/an | 3 397 €/m² | 3.2 |
| Statistiques Paris | 2 103 778 | 105 km² | 20 036 h/km² | 55.1% | 5.9% | 29 730 €/an | 10 271 €/m² | 3.2 |
| Statistiques Épinay-sur-Seine | 52 833 | 4 km² | 13 208 h/km² | 46.9% | 8.1% | 17 880 €/an | 2 781 €/m² | 3.1 |
| Statistiques Saint-Denis | 149 077 | 12 km² | 12 423 h/km² | 37% | 7.4% | 16 620 €/an | 3 775 €/m² | 2.3 |
| Statistiques Suresnes | 48 956 | 3 km² | 16 319 h/km² | 55.5% | 5.4% | 31 810 €/an | 6 827 €/m² | 3.1 |
Articles en relation
Acteur de l'économie locale :Faites découvrir vos services à Clichy
Clichy-la-Garenne : pourquoi cette ville du 92 séduit de plus en plus les acheteurs franciliens ?

Quels sont les diagnostics immobiliers obligatoires lors d’une vente ou d’une location en Île-de-France ?
Le bon plan de l'été pour faire baisser la facture de chauffage

Comment choisir entre un portail coulissant en alu et barreaudé pour votre maison?
Signalement de photo
Merci ! Votre signalement est envoyé !
Ajouter une photo de Clichy
Merci ! Votre photo sera diffusée sur le site après modération.