


Signalement de photo
Merci ! Votre signalement est envoyé !
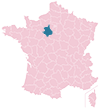
Quel est le nombre d'habitants à Bû ? Dans quel département et dans quelle région se situe la ville ? Quelle est sa superficie ?
Quels sont les chiffres de la délinquance ?
Découvrez sur cette page toutes les informations essentielles sur la population, la sécurité, les services et l'immobilier à Bû.
NOUVEAU : Rues sales, dépôts sauvages, dégradations urbaines. Faites votre signalement anonyme, nous nous chargeons de prévenir les autorités compétentes.
| Nombre d'habitants | 2 022 | Classement |
| Age moyen | 39 ans | Classement |
| Pop active | 49.1% | Classement |
| Taux chômage | 4% | Classement |
| Pop densité | 88 h/km² | Classement |
| Revenu moyen | 26 320 €/an | Classement |
| Agressions physiques / sexuelles | 0 |
| Cambriolages | 0 |
| Vols / dégradations | 8 |
| Stupéfiants | 0 |
Achat / Vente / Location Votre agence immobilière à Bû
| Prix moyen | 190 425 € | Prix moyen au m² | 2 029 € |
| Prix moyen | 207 300 € | Prix moyen au m² | 2 094 € |
Carte de la ville de Bû

Commerce |
|
|---|---|
|
Hypermarché (7km) Anet |
|
|
Supermarché (5km) Abondant |
|
| Boulangerie | 1 |
| Boucherie | 1 |
|
Station-service (5km) Abondant |
|
| Banque | 1 |
| La poste | 1 |
| Coiffeur | 3 |
|
Vétérinaire (5km) Rouvres |
|
| Restaurant | 2 |
Santé |
|
|---|---|
| Médecin | 2 |
|
Dentiste (7km) Anet |
|
| Pharmacie | 1 |
Éducation |
|
|---|---|
| Maternelle | 1 |
| Primaire | 1 |
| Collège | 1 |
|
Lycée (7km) Anet |
|


NOUVEAU : Décharges sauvages, détritus, objets abandonnés, graffitis, nids-de-poule : Déclarer un incident à Bû


 Marine LE PEN
 Emmanuel MACRON
 Jean-Luc MÉLENCHON
 Éric ZEMMOUR
 Valérie PÉCRESSE
 Yannick JADOT
 Fabien ROUSSEL
 Jean LASSALLE
 Nicolas DUPONT-AIGNAN
 Anne HIDALGO
 Philippe POUTOU
 Nathalie ARTHAUDEmmanuel MACRONMarine LE PEN
| Ville | Habitants | Superficie | Pop densité | Pop active | Taux chômage | Revenu moyen | Prix immobilier | Note globale |
|---|---|---|---|---|---|---|---|---|
| Statistiques Havelu | 127 | 4 km² | 32 h/km² | 58.3% | 4.7% | 32 040 €/an | 2 010 €/m² | - |
| Statistiques Marchezais | 406 | 2 km² | 203 h/km² | 54.2% | 3% | 27 950 €/an | 2 673 €/m² | - |
| Statistiques Serville | 364 | 6 km² | 61 h/km² | 54.7% | 3.8% | 25 130 €/an | 2 391 €/m² | - |
| Statistiques Rouvres | 833 | 16 km² | 52 h/km² | 49% | 3.8% | 27 020 €/an | 2 222 €/m² | - |
| Statistiques Goussainville | 1 309 | 13 km² | 101 h/km² | 53.6% | 4.1% | 27 040 €/an | 2 765 €/m² | 3.6 |
| Statistiques Saint-Lubin-de-la-Haye | 918 | 14 km² | 66 h/km² | 55.2% | 3.6% | 28 620 €/an | 2 666 €/m² | 4.0 |
| Statistiques Abondant | 2 427 | 35 km² | 69 h/km² | 49.1% | 3.8% | 26 810 €/an | 2 126 €/m² | 3.9 |
| Statistiques Broué | 882 | 12 km² | 74 h/km² | 55.6% | 5.1% | 26 850 €/an | 2 103 €/m² | - |
| Statistiques Germainville | 330 | 9 km² | 37 h/km² | 45.8% | 2.1% | 27 700 €/an | 1 687 €/m² | 3.0 |
| Statistiques Boncourt | 271 | 4 km² | 68 h/km² | 47.6% | 5.5% | 25 730 €/an | 1 851 €/m² | - |
| Statistiques Saint-Ouen-Marchefroy | 297 | 9 km² | 33 h/km² | 45.8% | 4.4% | 29 700 €/an | 2 190 €/m² | - |
| Statistiques Berchères-sur-Vesgre | 849 | 12 km² | 71 h/km² | 48.2% | 5.2% | 28 100 €/an | 2 339 €/m² | - |
| Statistiques Anet | 2 696 | 8 km² | 337 h/km² | 41.5% | 4% | 24 220 €/an | 2 130 €/m² | 3.2 |
| Statistiques Cherisy | 1 827 | 12 km² | 152 h/km² | 45.9% | 4.5% | 25 810 €/an | 2 074 €/m² | 2.6 |
| Statistiques Houdan | 3 699 | 10 km² | 370 h/km² | 49% | 5.1% | 24 540 €/an | 2 853 €/m² | 4.2 |