


Signalement de photo
Merci ! Votre signalement est envoyé !
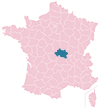
Quel est le nombre d'habitants à Brugheas ? Dans quel département et dans quelle région se situe la ville ? Quelle est sa superficie ?
Quels sont les chiffres de la délinquance ?
Découvrez sur cette page toutes les informations essentielles sur la population, la sécurité, les services et l'immobilier à Brugheas.
NOUVEAU : Rues sales, dépôts sauvages, dégradations urbaines. Faites votre signalement anonyme, nous nous chargeons de prévenir les autorités compétentes.
| Nombre d'habitants | 1 547 | Classement |
| Age moyen | 43 ans | Classement |
| Pop active | 46% | Classement |
| Taux chômage | 3.9% | Classement |
| Pop densité | 57 h/km² | Classement |
| Revenu moyen | 23 830 €/an | Classement |
| Agressions physiques / sexuelles | 0 |
| Cambriolages | 0 |
| Vols / dégradations | 6 |
| Stupéfiants | 0 |
Achat / Vente / Location Votre agence immobilière à Brugheas
| Prix moyen | 88 459 € | Prix moyen au m² | 887 € |
| Prix moyen | 22 761 € | Prix moyen au m² | 332 € |
Carte de la ville de Brugheas

Commerce |
|
|---|---|
|
Hypermarché (5km) Bellerive-sur-Allier |
|
|
Supermarché (5km) Bellerive-sur-Allier |
|
|
Boulangerie (5km) Bellerive-sur-Allier |
|
| Boucherie | 1 |
|
Station-service (5km) Bellerive-sur-Allier |
|
|
Banque (5km) Bellerive-sur-Allier |
|
|
La poste (5km) Bellerive-sur-Allier |
|
|
Coiffeur (5km) Bellerive-sur-Allier |
|
|
Vétérinaire (5km) Bellerive-sur-Allier |
|
| Restaurant | 2 |
Santé |
|
|---|---|
|
Médecin (5km) Bellerive-sur-Allier |
|
|
Dentiste (5km) Bellerive-sur-Allier |
|
|
Pharmacie (5km) Bellerive-sur-Allier |
|
Éducation |
|
|---|---|
| Maternelle | 1 |
| Primaire | 1 |
|
Collège (5km) Bellerive-sur-Allier |
|
|
Lycée (5km) Vichy |
|


NOUVEAU : Décharges sauvages, détritus, objets abandonnés, graffitis, nids-de-poule : Déclarer un incident à Brugheas


 Emmanuel MACRON
 Marine LE PEN
 Jean-Luc MÉLENCHON
 Éric ZEMMOUR
 Jean LASSALLE
 Valérie PÉCRESSE
 Yannick JADOT
 Nicolas DUPONT-AIGNAN
 Fabien ROUSSEL
 Anne HIDALGO
 Philippe POUTOU
 Nathalie ARTHAUDEmmanuel MACRONMarine LE PEN
| Ville | Habitants | Superficie | Pop densité | Pop active | Taux chômage | Revenu moyen | Prix immobilier | Note globale |
|---|---|---|---|---|---|---|---|---|
| Statistiques Serbannes | 813 | 14 km² | 58 h/km² | 45.3% | 3.4% | 25 480 €/an | 1 332 €/m² | - |
| Statistiques Saint-Sylvestre-Pragoulin | 1 067 | 24 km² | 44 h/km² | 46.8% | 3.5% | 22 360 €/an | 1 322 €/m² | - |
| Statistiques Bellerive-sur-Allier | 8 855 | 19 km² | 466 h/km² | 36.6% | 5.4% | 23 070 €/an | 1 600 €/m² | 3.8 |
| Statistiques Vichy | 25 789 | 6 km² | 4 298 h/km² | 34.2% | 7.4% | 20 190 €/an | 1 427 €/m² | 3.6 |
| Statistiques Abrest | 2 919 | 10 km² | 292 h/km² | 46.3% | 4.8% | 23 170 €/an | 1 385 €/m² | 3.4 |
| Statistiques Cognat-Lyonne | 708 | 13 km² | 54 h/km² | 47.7% | 2.4% | 22 770 €/an | 1 136 €/m² | - |
| Statistiques Hauterive | 1 186 | 8 km² | 148 h/km² | 45.4% | 5.6% | 22 750 €/an | 952 €/m² | 3.2 |
| Statistiques Espinasse-Vozelle | 974 | 18 km² | 54 h/km² | 46.2% | 3.7% | 24 210 €/an | 1 625 €/m² | - |
| Statistiques Randan | 1 620 | 16 km² | 101 h/km² | 40.3% | 4.1% | 21 250 €/an | 1 014 €/m² | 3.8 |
| Statistiques Vendat | 2 254 | 17 km² | 133 h/km² | 44.9% | 3.9% | 25 300 €/an | 1 060 €/m² | - |
| Statistiques Saint-Priest-Bramefant | 868 | 19 km² | 46 h/km² | 47.8% | 3.8% | 22 580 €/an | 1 178 €/m² | - |
| Statistiques Villeneuve-les-Cerfs | 514 | 10 km² | 51 h/km² | 43.4% | 4.3% | 23 200 €/an | 1 374 €/m² | 2.2 |
| Statistiques Le Vernet | 1 913 | 10 km² | 191 h/km² | 43.6% | 3.4% | 25 620 €/an | 1 010 €/m² | 2.6 |
| Statistiques Biozat | 901 | 16 km² | 56 h/km² | 48.1% | 3.3% | 22 480 €/an | 1 010 €/m² | 4.4 |
| Statistiques Saint-Yorre | 2 595 | 6 km² | 433 h/km² | 39.4% | 4.8% | 21 180 €/an | 1 359 €/m² | 3.7 |