Bienvenue à Nexon, ville du département de la Haute-Vienne en région Nouvelle-Aquitaine. Comptabilisant aujourd'hui 2 548 habitants, la ville évolue en s'adaptant aux réalités de son territoire et aux besoins de sa population sous la gestion de son maire Nicolas LATOUR.
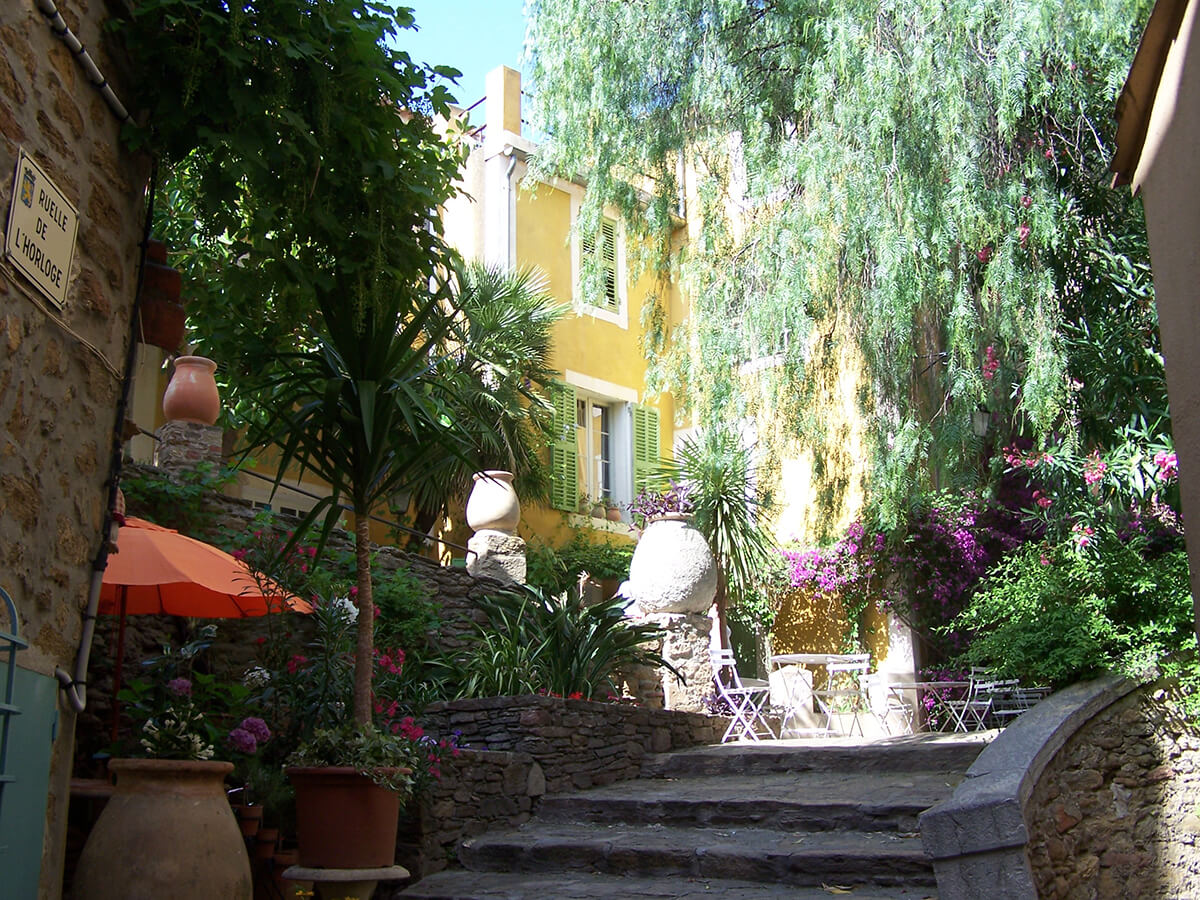
Reconnue pour la qualité remarquable de son patrimoine végétal et la régularité de ses efforts d'embellissement, Nexon est labellisée Villes et Villages Fleuris avec la distinction de 3 fleurs.
Statistiques sur la population
Quel est le profil de la population, sa situation démographique ?
Aujourd'hui, en 2026, la population de Nexon est estimée à 2 508 habitants selon un modèle de régression linéaire appliqué aux dix dernières années. (2 512 en 2025).
Les derniers chiffres officiels publiés par la source INSEE en 2026 portent sur la population de 2023 qui enregistre une hausse de 0.2% sur un an.
Sources : Institut national de la statistique et des études économiques (insee) selon Les dernières parutions officielles de 2025 portant sur les années 2020, 2021 et 2022.
Insécurité, faits divers : les chiffres de la délinquance
Pour comparer(en proportion du nombre d'habitants)
La ville
Bilan sécurité 2026 : la ville de Nexon est-elle sûre ?
L'examen récent des indices de criminalité à Nexon révèle une situation favorable. Le climat sécuritaire y est serein, avec des indicateurs de délinquance majoritairement inférieurs aux moyennes nationales.
Atteintes à l'intégrité physique : Concernant les atteintes à l'intégrité physique, la ville affiche un bilan positif avec un taux d'agressions et de violences volontaires nettement inférieur aux seuils nationaux. 0 faits recensés en 2025, en baisse de 0 % sur un an.
Cambriolages : La protection des domiciles est efficace : le taux de cambriolages de logements reste très inférieur à la moyenne, limitant l'exposition des résidents à ce risque. 0 effractions constatées en 2025, en diminution de 0 % sur un an.
Vols et dégradations : La délinquance de proximité, incluant les vols et le vandalisme, est contenue. Les chiffres montrent une commune relativement épargnée par les dégradations urbaines. 32 infractions enregistrées en 2025, en recul de 17.9 % sur un an.
Stupéfiants : La thématique des stupéfiants marque un point de tension : les faits de trafic ou d'usage recensés sont supérieurs aux seuils de référence nationaux. 12 signalements en 2025, marquant une hausse de 0 % sur un an.
Sources : Bases statistiques communale, départementale et régionale de la délinquance enregistrée par la police et la gendarmerie nationales selon les dernières parutions officielles de 2026 portant sur l'année 2025 (data.gouv).
Agressions physiques / sexuelles : Violences sexuelles, coups et blessures volontaires intrafamiliaux, coups et blessures volontaires, autres coups, blessures volontaires et vols violents sans arme.
Cambriolages : Cambriolages de logements.
Vols : Vols avec armes, vols d'accessoires sur véhicules, vols dans les véhicules, vols de véhicules, vols sans violence contre des personnes, destructions, dégradations volontaires et escroqueries.
Stupéfiants : Trafic de stupéfiants dont (AFD) et usage de stupéfiants.
La ville comptabilise de nombreux commerces divers et variés.
La ville compte 1 médecin pour 637 habitants.
La ville dispose de plusieurs établissements scolaire public mais pas de lycée.
Sources : Base Sirene des entreprises et de leurs établissements selon les dernières parutions officielles de 2025 portant sur l'année 2024 (data.gouv). Liste, localisation et tarifs des professionnels de santé selon les dernières parutions officielles de 2025 portant sur l'année 2024 (opendatasoft) et FINESS Extraction du Fichier des établissements selon les dernières parutions officielles de 2025 portant sur l'année 2024 (data.gouv). Adresse et géolocalisation des établissements d'enseignement du premier et second degrés selon les dernières parutions officielles de 2025 portant sur l'année 2024 (data.education.gouv)