


Signalement de photo
Merci ! Votre signalement est envoyé !
Quel est le nombre d'habitants à Monts ? Dans quel département et dans quelle région se situe la ville ? Quelle est sa superficie ?
Quels sont les chiffres de la délinquance ?
Découvrez sur cette page toutes les informations essentielles sur la population, la sécurité, les services et l'immobilier à Monts.
NOUVEAU : Rues sales, dépôts sauvages, dégradations urbaines. Faites votre signalement anonyme, nous nous chargeons de prévenir les autorités compétentes.
| Nombre d'habitants | 7 914 | Classement |
| Age moyen | 42 ans | Classement |
| Pop active | 47.8% | Classement |
| Taux chômage | 3.6% | Classement |
| Pop densité | 293 h/km² | Classement |
| Revenu moyen | 25 100 €/an | Classement |
| Agressions physiques / sexuelles | 43 |
| Cambriolages | 21 |
| Vols / dégradations | 51 |
| Stupéfiants | 0 |
Achat / Vente / Location Votre agence immobilière à Monts
| Prix moyen | 201 862 € | Prix moyen au m² | 2 036 € |
| Prix moyen | 118 707 € | Prix moyen au m² | 1 603 € |
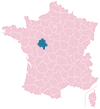
Carte de la ville de Monts

Commerce |
|
|---|---|
|
Hypermarché (8km) Joué-lès-Tours |
|
| Supermarché | 2 |
| Boulangerie | 2 |
| Boucherie | 1 |
| Station-service | 1 |
| Banque | 1 |
| La poste | 1 |
| Coiffeur | 7 |
| Vétérinaire | 1 |
| Restaurant | 10 |
Santé |
|
|---|---|
| Médecin | 8 |
| Dentiste | 3 |
| Pharmacie | 3 |
Éducation |
|
|---|---|
| Maternelle | 2 |
| Primaire | 2 |
| Collège | 1 |
|
Lycée (8km) Joué-lès-Tours |
|


NOUVEAU : Décharges sauvages, détritus, objets abandonnés, graffitis, nids-de-poule : Déclarer un incident à Monts


 Emmanuel MACRON
 Marine LE PEN
 Jean-Luc MÉLENCHON
 Yannick JADOT
 Éric ZEMMOUR
 Valérie PÉCRESSE
 Fabien ROUSSEL
 Jean LASSALLE
 Anne HIDALGO
 Nicolas DUPONT-AIGNAN
 Philippe POUTOU
 Nathalie ARTHAUDEmmanuel MACRONMarine LE PEN
| Ville | Habitants | Superficie | Pop densité | Pop active | Taux chômage | Revenu moyen | Prix immobilier | Note globale |
|---|---|---|---|---|---|---|---|---|
| Statistiques Artannes-sur-Indre | 2 734 | 21 km² | 130 h/km² | 47.8% | 3.1% | 26 100 €/an | 1 815 €/m² | 5.0 |
| Statistiques Pont-de-Ruan | 1 215 | 6 km² | 203 h/km² | 51.7% | 3.6% | 23 760 €/an | 1 915 €/m² | 3.2 |
| Statistiques Ballan-Miré | 8 217 | 26 km² | 316 h/km² | 44.4% | 4.4% | 26 590 €/an | 2 483 €/m² | 4.2 |
| Statistiques Saché | 1 403 | 28 km² | 50 h/km² | 51.2% | 3.1% | 24 320 €/an | 1 795 €/m² | 3.8 |
| Statistiques Montbazon | 4 717 | 7 km² | 674 h/km² | 46.7% | 3.6% | 25 210 €/an | 2 415 €/m² | 3.6 |
| Statistiques Thilouze | 1 790 | 34 km² | 53 h/km² | 51.8% | 3.9% | 23 950 €/an | 2 008 €/m² | - |
| Statistiques Joué-lès-Tours | 38 183 | 32 km² | 1 193 h/km² | 44.6% | 7.3% | 21 520 €/an | 1 963 €/m² | 3.4 |
| Statistiques Sorigny | 2 817 | 43 km² | 66 h/km² | 50.9% | 3.7% | 23 890 €/an | 2 053 €/m² | 4.8 |
| Statistiques Druye | 973 | 23 km² | 42 h/km² | 51.3% | 2.5% | 24 340 €/an | 2 401 €/m² | 4.6 |
| Statistiques Veigné | 6 568 | 27 km² | 243 h/km² | 46% | 3.2% | 26 460 €/an | 2 193 €/m² | 4.6 |
| Statistiques Savonnières | 3 294 | 16 km² | 206 h/km² | 47.5% | 2.8% | 27 530 €/an | 2 525 €/m² | 4.8 |
| Statistiques Villeperdue | 1 093 | 12 km² | 91 h/km² | 53.2% | 5.6% | 21 700 €/an | 1 503 €/m² | 4.4 |
| Statistiques Villandry | 1 136 | 18 km² | 63 h/km² | 54% | 2.8% | 26 000 €/an | 1 745 €/m² | - |
| Statistiques Chambray-lès-Tours | 11 589 | 19 km² | 610 h/km² | 46.8% | 6.7% | 24 280 €/an | 2 300 €/m² | 3.7 |
| Statistiques Saint-Genouph | 1 025 | 5 km² | 205 h/km² | 52.3% | 2.7% | 25 490 €/an | 1 986 €/m² | - |