
Bienvenue à Lannemezan, ville du département des Hautes-Pyrénées en région Occitanie. Comptabilisant aujourd'hui 5 811 habitants, la ville évolue en s'adaptant aux réalités de son territoire et aux besoins de sa population sous la gestion de son maire Laurent LAGES.
Présentation

Statistiques sur la population
Quel est le profil de la population, sa situation démographique ?
| Nombre d'habitants | 5 811 | Classement |
|---|---|---|
| Age moyen | 48 ans | Classement |
| Pop active | 38% | Classement |
| Taux chômage | 8.3% | Classement |
| Pop densité | 306 h/km² | Classement |
| Revenu moyen | 20 400 €/an | Classement |
Evolution du nombre d'habitants
Aujourd'hui, en 2026, la population de Lannemezan est estimée à 5 752 habitants selon un modèle de régression linéaire appliqué aux dix dernières années. (5 764 en 2025).
Les derniers chiffres officiels publiés par la source INSEE en 2026 portent sur la population de 2023 qui enregistre une hausse de 0% sur un an.
Les derniers chiffres officiels publiés par la source INSEE en 2026 portent sur la population de 2023 qui enregistre une hausse de 0% sur un an.
Tranche d'âge


0-14 ans
12%

15-29 ans
14%

30-44 ans
15%

45-59 ans
23%

60-74 ans
20%

75-89 ans
14%

90 ans et +
2%
Activité professionnelle


Agriculteurs
1%

Artisans, Commerçants
3%

Cadres et sup.
2%

Professions intermédiaires
8%

Employé
16%

Ouvrier
7%

Retraité
33%

Autres
19%
Niveau de diplôme


Sans diplôme ou CEP
30%

Brevet, BEPC, DNB
7%

CAP-BEP ou équivalent
26%

BAC ou équivalent
17%

BAC+2
10%

BAC+3 ou +4
7%

BAC+5 ou plus
3%
Composition des ménages


Couple sans enfant
34%

Couple avec enfant(s)
19%

Famille monoparentale
8%

Colocation / Autre
3%

Personnes seules
36%
Profils électoraux
Quels sont les résultats des dernières élections aux présidentiels 2022 ?
Premier tour
 Marine LE PEN
25.21 %
 Emmanuel MACRON
24.14 %
 Jean-Luc MÉLENCHON
18.66 %
 Jean LASSALLE
10.57 %
 Éric ZEMMOUR
7.23 %
 Yannick JADOT
3.34 %
 Valérie PÉCRESSE
3.34 %
 Fabien ROUSSEL
2.24 %
 Anne HIDALGO
2.13 %
 Nicolas DUPONT-AIGNAN
1.65 %
 Philippe POUTOU
0.76 %
 Nathalie ARTHAUD
0.72 %
3 914 inscrits
Participation : 75.7%
Votes blancs : 1.28%
Votes nuls : 0.71%
Participation : 75.7%
Votes blancs : 1.28%
Votes nuls : 0.71%
Second tour
Emmanuel MACRON51,22 %
Marine LE PEN48,78 %
3 914 inscrits
Participation : 73.91%
Votes blancs : 6.88%
Votes nuls : 3.7%
Participation : 73.91%
Votes blancs : 6.88%
Votes nuls : 3.7%
Bon à savoir :
- Le revenu moyen par habitant à Lannemezan (20 400 €) est en dessous de la moyenne nationale (20 590 €).
- La part de la population au chômage (8.3%) est supérieure à la moyenne nationale (8%).
- Le taux de chômage indiqué est au sens du BIT qui se distingue du taux de chômage au sens du recensement de la population.
Sources : Institut national de la statistique et des études économiques (insee) selon Les dernières parutions officielles de 2025 portant sur les années 2020, 2021 et 2022.
Sécurité, faits divers : les chiffres de la délinquance
| Agressions physiques / sexuelles | 126 |
|---|---|
| Cambriolages | 22 |
| Vols / dégradations | 185 |
| Stupéfiants | 63 |
Evolution du nombre d'infractions
Pour comparer(en proportion du nombre d'habitants)
La ville
Bilan sécurité 2025 : la ville de Lannemezan est-elle sûre ?
L'examen des indices de criminalité à Lannemezan pour l'année 2025 révèle une situation critique. La ville présente une situation sous tension, avec des faits constatés significativement supérieurs aux seuils de référence.
- Atteintes à l'intégrité physique : Le volet des violences et agressions constitue un point de vigilance : l'indice de victimation local est supérieur aux moyennes nationales, marquant une tension sur la sécurité des personnes.
- Cambriolages : La ville fait face à une pression sur les cambriolages. Le nombre d'effractions de logements dépasse les indicateurs de référence, nécessitant une vigilance accrue des habitants.
- Vols et dégradations : On note une récurrence des faits de petite délinquance. Les indicateurs de vols et destructions volontaires sont supérieurs à la moyenne, pesant sur le sentiment de sécurité.
- Stupéfiants : La thématique des stupéfiants marque un point de tension : les faits de trafic ou d'usage recensés sont supérieurs aux seuils de référence nationaux.
Sources : Bases statistiques communale, départementale et régionale de la délinquance enregistrée par la police et la gendarmerie nationales selon les dernières parutions officielles de 2026 portant sur l'année 2025 (data.gouv).
Agressions physiques / sexuelles : Violences sexuelles, coups et blessures volontaires intrafamiliaux, coups et blessures volontaires, autres coups, blessures volontaires et vols violents sans arme.
Cambriolages : Cambriolages de logements.
Vols : Vols avec armes, vols d'accessoires sur véhicules, vols dans les véhicules, vols de véhicules, vols sans violence contre des personnes, destructions, dégradations volontaires et escroqueries.
Stupéfiants : Trafic de stupéfiants dont (AFD) et usage de stupéfiants.
Services à la population
Commerce |
|
|---|---|
|
Hypermarché Gourdan-Polignan 18km |
|
| Supermarché | 3 |
| Supérette | 4 |
| Boulangerie | 6 |
| Boucherie | 1 |
| Restaurant | 11 |
| Garage | 15 |
| Station-service | 2 |
| Banque | 8 |
| La poste | 2 |
| Coiffeur | 23 |
| Tabac | 2 |
| Bars / discothèque | 7 |
|
Bibliothèque Le Cuing 19km |
|
| Cinéma | 3 |
| Vétérinaire | 7 |
Santé |
|
|---|---|
| Pharmacie | 3 |
| Hôpital | 3 |
| Laboratoire d'analyses médicales | 2 |
| Etablissement pour handicapé | 5 |
| EHPA | 2 |
| Médecin | 5 |
| Dentiste | 4 |
| Chirurgien | 1 |
|
Dermatologue Tarbes 27km |
|
|
Anesthésiste Tarbes 27km |
|
|
Gastro-entérologue Tarbes 27km |
|
|
Gynécologue Saint-Gaudens 26km |
|
|
Cancérologue Tarbes 27km |
|
|
Neurologue Tarbes 27km |
|
| Ophtalmologue | 1 |
|
ORL Tarbes 27km |
|
|
Cardiologue Saint-Plancard 16km |
|
|
Pédiatre Tarbes 26km |
|
|
Pneumologue Saint-Plancard 16km |
|
|
Psychologue Montréjeau 16km |
|
| Radiologue | 3 |
|
Rhumatologue Tarbes 27km |
|
|
Sage-femme Bagnères-de-Bigorre 20km |
|
Éducation |
|
|---|---|
| Crèche | 4 |
|
Ecole maternelle Public Lutilhous 4km |
|
|
Ecole maternelle Privé Plaisance-du-Touch 89km |
|
| Ecole primaire Public | 4 |
|
Ecole primaire Privé Cantaous 6km |
|
| Collège Public | 1 |
|
Collège Privé Benqué-Molère 8km |
|
| Lycée Public | 1 |
|
Lycée Privé Monléon-Magnoac 14km |
|
Bon à savoir :
- La ville comptabilise de nombreux commerces divers et variés.
- La ville compte 1 médecin pour 1162 habitants.
Sources : Base Sirene des entreprises et de leurs établissements selon les dernières parutions officielles de 2025 portant sur l'année 2024 (data.gouv). Liste, localisation et tarifs des professionnels de santé selon les dernières parutions officielles de 2025 portant sur l'année 2024 (opendatasoft) et FINESS Extraction du Fichier des établissements selon les dernières parutions officielles de 2025 portant sur l'année 2024 (data.gouv). Adresse et géolocalisation des établissements d'enseignement du premier et second degrés selon les dernières parutions officielles de 2025 portant sur l'année 2024 (data.education.gouv)
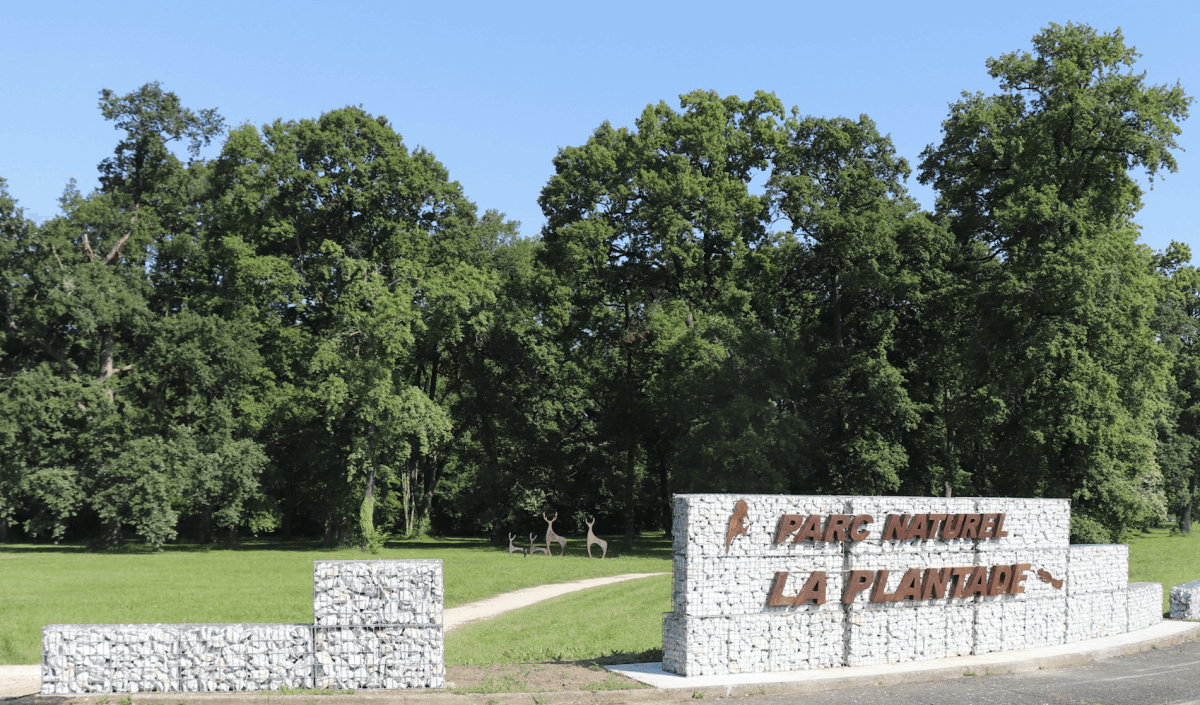
Carte et superficie
Carte de la ville de Lannemezan
Bon à savoir :
- Lannemezan est rattachée aux collectivités territoriales de la région Occitanie, du département Hautes-Pyrénées
- Le code postal de Lannemezan est 65300.
- Lannemezan s'étend sur une superficie de 19 km². Classement
- Les villes voisines les plus proches sont Campistrous, Grange, Uglas, Lutilhous et Pinas

Mairie de Lannemezan
M. Laurent LAGES
Maire de Lannemezan
Maire de Lannemezan
Adresse
1 place de la République 65300 LannemezanContact
Heures d'ouvertures
Lundi : 08:30-12:00 13:30-17:30Mardi : 08:30-12:00 13:30-17:30
Mercredi : 08:30-12:00 13:30-17:30
Jeudi : 08:30-12:00 13:30-17:30
Vendredi : 08:30-12:00 13:30-17:30
Samedi : Fermé
Dimanche : Fermé
Photos de Lannemezan
-
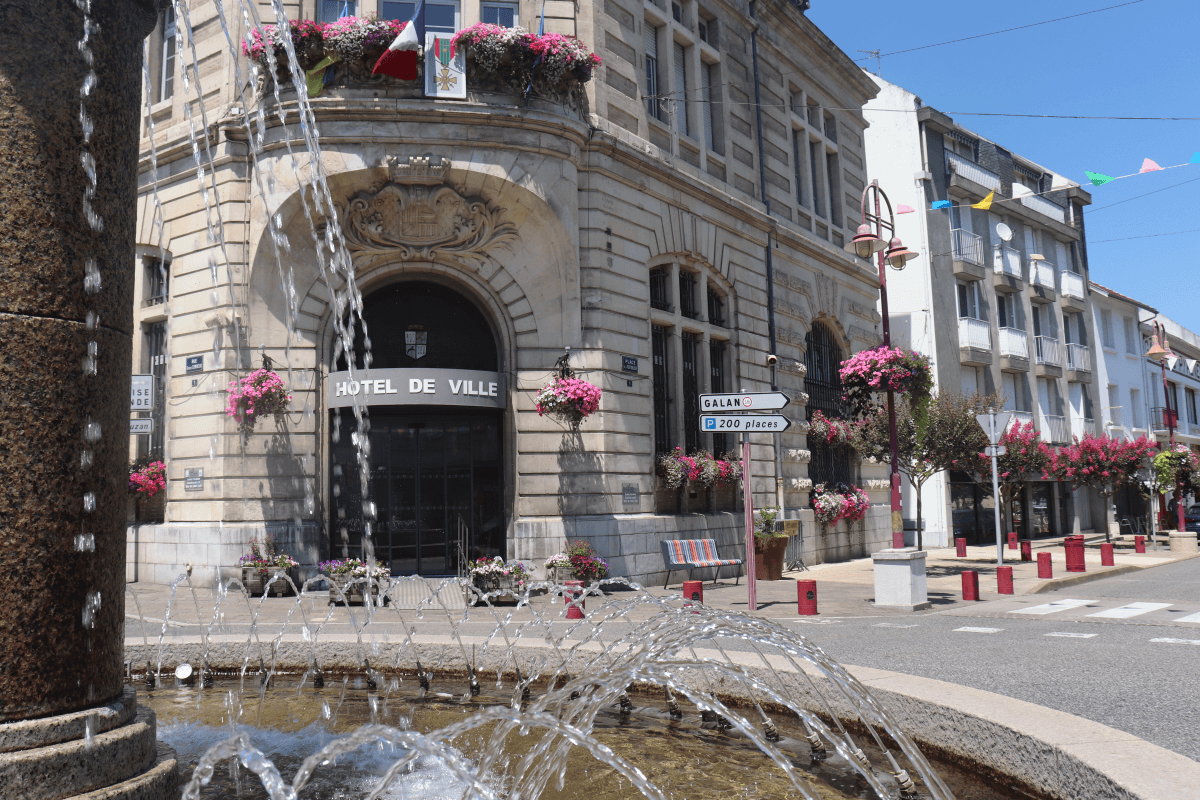
Place de la République
Auteur : Cécile
-
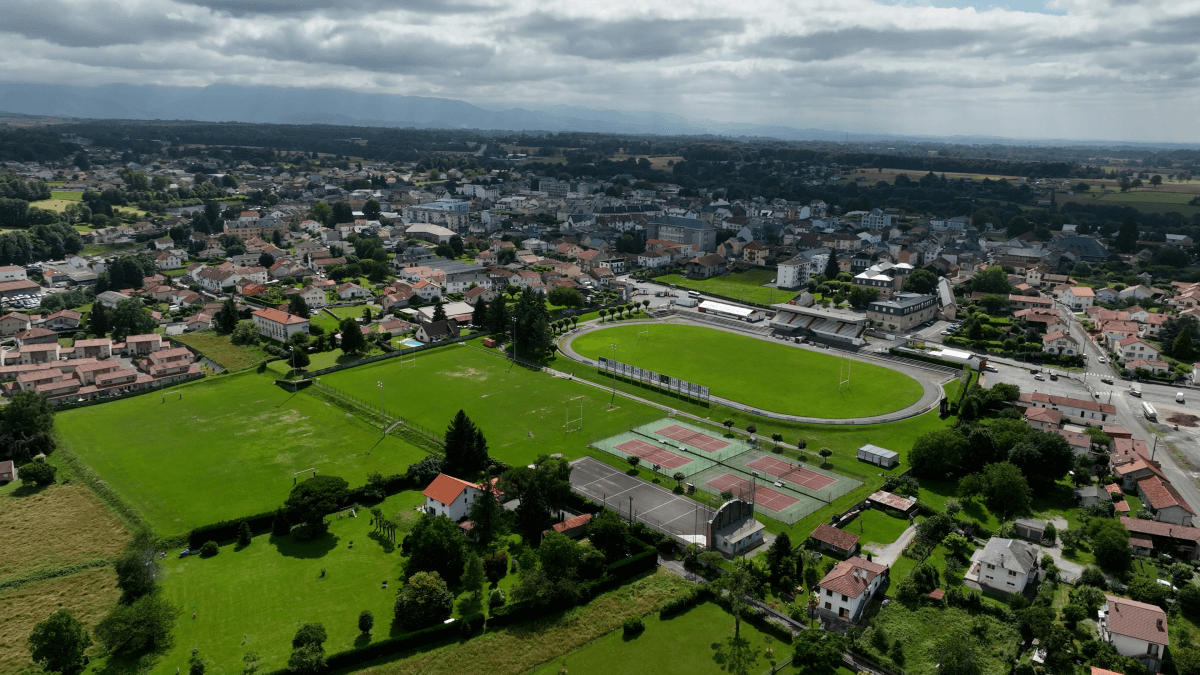
Ville sportive
Auteur : Cécile
-
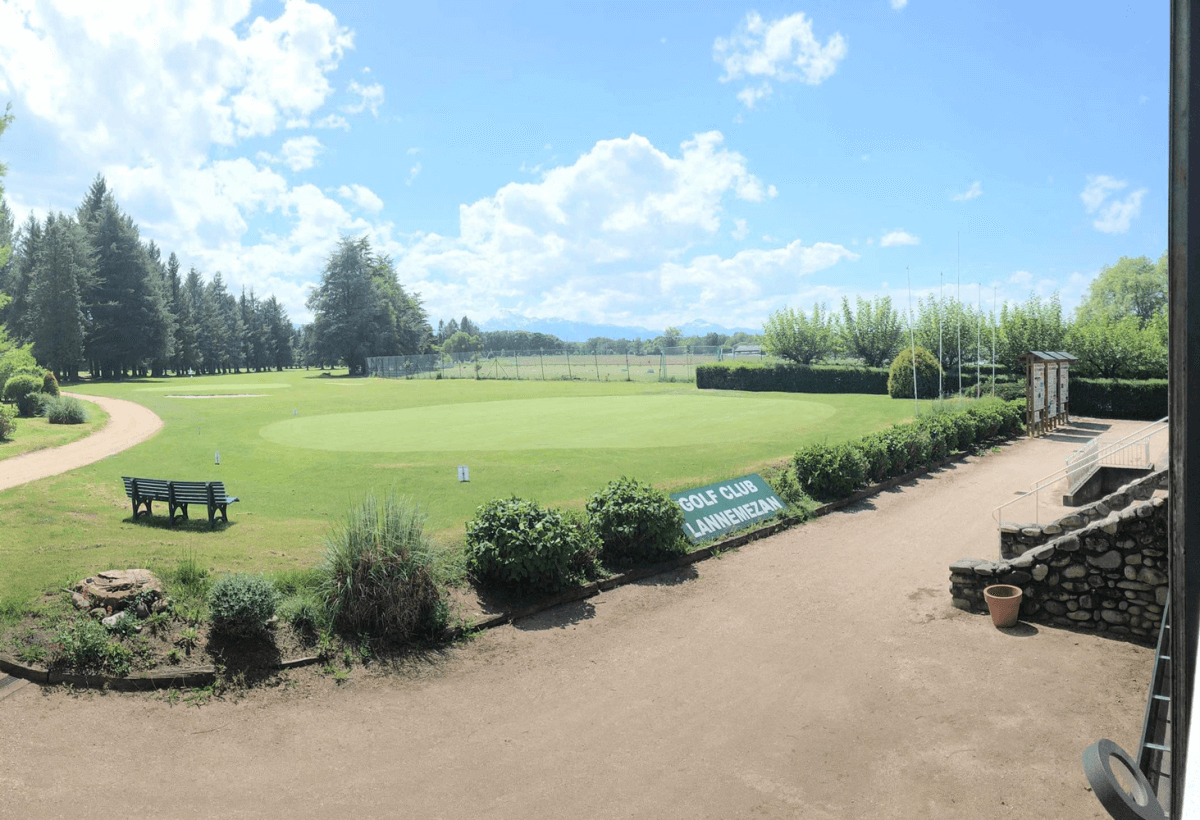
Golf
Auteur : Cécile
-
Route de la Barthe de Neste
Auteur : Cécile
Villes autour de Lannemezan
| Ville | Habitants | Superficie | Pop densité | Pop active | Taux chômage | Revenu moyen | Prix immobilier | Note globale |
|---|---|---|---|---|---|---|---|---|
| Statistiques Campistrous | 314 | 10 km² | 31 h/km² | 40.4% | 3.2% | 24 670 €/an | 1 522 €/m² | - |
| Statistiques Grange | 261 | 3 km² | 87 h/km² | 43.3% | 3.8% | 24 010 €/an | 1 384 €/m² | - |
| Statistiques Uglas | 274 | 8 km² | 34 h/km² | 40.1% | 2.9% | 23 350 €/an | 855 €/m² | - |
| Statistiques Lutilhous | 210 | 3 km² | 70 h/km² | 50.5% | 4.8% | 24 650 €/an | 1 336 €/m² | - |
| Statistiques Pinas | 441 | 5 km² | 88 h/km² | 41.5% | 4.5% | 22 940 €/an | 1 478 €/m² | - |
| Statistiques Bégole | 189 | 10 km² | 19 h/km² | 46% | 2.6% | 22 370 €/an | 1 288 €/m² | 2.8 |
| Statistiques Houeydets | 287 | 7 km² | 41 h/km² | 47.4% | 3.8% | 22 410 €/an | 1 186 €/m² | - |
| Statistiques Clarens | 513 | 11 km² | 47 h/km² | 43.9% | 1.2% | 24 070 €/an | 1 537 €/m² | - |
| Statistiques Caharet | 30 | 1 km² | 30 h/km² | 46.7% | 6.7% | NC | NC | - |
| Statistiques La Barthe-de-Neste | 1 240 | 7 km² | 177 h/km² | 43.3% | 3.9% | 22 760 €/an | 1 636 €/m² | - |
| Statistiques Réjaumont | 146 | 6 km² | 24 h/km² | 43.2% | 2.7% | 22 520 €/an | 1 430 €/m² | - |
| Statistiques Galez | 181 | 7 km² | 26 h/km² | 42.5% | 1.7% | 21 070 €/an | 2 313 €/m² | - |
| Statistiques Escala | 347 | 3 km² | 116 h/km² | 42.1% | 4.3% | 22 430 €/an | 1 724 €/m² | - |
| Statistiques Cantaous | 424 | 5 km² | 85 h/km² | 36.6% | 4.2% | 22 940 €/an | 556 €/m² | - |
| Statistiques Castelbajac | 132 | 8 km² | 17 h/km² | 45.5% | 5.3% | 21 310 €/an | 1 125 €/m² | - |
Articles en relation
Acteur de l'économie locale :Faites découvrir vos services à Lannemezan
Signalement de photo
Merci ! Votre signalement est envoyé !
Ajouter une photo de Lannemezan
Merci ! Votre photo sera diffusée sur le site après modération.