
Bienvenue à Harbonnières, ville du département de la Somme en région Hauts-de-France. Comptabilisant aujourd'hui 1 640 habitants, la ville évolue en s'adaptant aux réalités de son territoire et aux besoins de sa population sous la gestion de son maire Georgette SCIASCIA.
Présentation
Statistiques sur la population
Quel est le profil de la population, sa situation démographique ?
| Nombre d'habitants | 1 640 | Classement |
|---|---|---|
| Age moyen | 37 ans | Classement |
| Pop active | 41.3% | Classement |
| Taux chômage | 11.9% | Classement |
| Pop densité | 109 h/km² | Classement |
| Revenu moyen | 19 390 €/an | Classement |
Evolution du nombre d'habitants
Aujourd'hui, en 2026, la population de Harbonnières est estimée à 1 632 habitants selon un modèle de régression linéaire appliqué aux dix dernières années. (1 634 en 2025).
Les derniers chiffres officiels publiés par la source INSEE en 2026 portent sur la population de 2023 qui enregistre une hausse de 0% sur un an.
Les derniers chiffres officiels publiés par la source INSEE en 2026 portent sur la population de 2023 qui enregistre une hausse de 0% sur un an.
Tranche d'âge


0-14 ans
22%

15-29 ans
19%

30-44 ans
21%

45-59 ans
19%

60-74 ans
15%

75-89 ans
5%

90 ans et +
1%
Activité professionnelle


Agriculteurs
1%

Artisans, Commerçants
2%

Cadres et sup.
2%

Professions intermédiaires
6%

Employé
14%

Ouvrier
19%

Retraité
15%

Autres
18%
Niveau de diplôme


Sans diplôme ou CEP
42%

Brevet, BEPC, DNB
4%

CAP-BEP ou équivalent
29%

BAC ou équivalent
12%

BAC+2
7%

BAC+3 ou +4
3%

BAC+5 ou plus
2%
Composition des ménages


Couple sans enfant
32%

Couple avec enfant(s)
39%

Famille monoparentale
6%

Colocation / Autre
6%

Personnes seules
17%
Profils électoraux
Quels sont les résultats des dernières élections aux présidentiels 2022 ?
Premier tour
 Marine LE PEN
51.60 %
 Emmanuel MACRON
17.55 %
 Jean-Luc MÉLENCHON
13.70 %
 Éric ZEMMOUR
4.92 %
 Valérie PÉCRESSE
4.39 %
 Jean LASSALLE
2.66 %
 Fabien ROUSSEL
2.53 %
 Yannick JADOT
0.93 %
 Nicolas DUPONT-AIGNAN
0.80 %
 Anne HIDALGO
0.66 %
 Nathalie ARTHAUD
0.27 %
 Philippe POUTOU
0.00 %
987 inscrits
Participation : 78.12%
Votes blancs : 1.30%
Votes nuls : 1.17%
Participation : 78.12%
Votes blancs : 1.30%
Votes nuls : 1.17%
Second tour
Emmanuel MACRON28,14 %
Marine LE PEN71,86 %
987 inscrits
Participation : 78.93%
Votes blancs : 4.11%
Votes nuls : 1.93%
Participation : 78.93%
Votes blancs : 4.11%
Votes nuls : 1.93%
Bon à savoir :
- Le revenu moyen par habitant à Harbonnières (19 390 €) est en dessous de la moyenne nationale (20 590 €).
- La part de la population au chômage (11.9%) est supérieure à la moyenne nationale (8%).
- Le taux de chômage indiqué est au sens du BIT qui se distingue du taux de chômage au sens du recensement de la population.
Sources : Institut national de la statistique et des études économiques (insee) selon Les dernières parutions officielles de 2025 portant sur les années 2020, 2021 et 2022.
Insécurité, faits divers : les chiffres de la délinquance
5.9/10
Note globale
contrastée
Indice de Tranquillité
Bien-dans-ma-ville
Bien-dans-ma-ville
| Agressions physiques / sexuelles | 47 | Classement |
|---|---|---|
| Cambriolages | 0 | Classement |
| Vols / dégradations | 29 | Classement |
| Stupéfiants | 0 | Classement |
Méthodologie de calcul : L'Indice de Tranquillité
L'Indice de Tranquillité développé par Bien-dans-ma-ville.fr est un outil d'analyse statistique avancé. Pour garantir une équité totale entre les communes, toutes les données brutes de la délinquance sont ramenées à un taux pour 1 000 habitants.
Notre algorithme applique un calcul continu et proportionnel, sans paliers injustes, basé sur la moyenne nationale.
1. La pondération des indicateurs selon leur gravité
Chaque catégorie de délinquance reçoit un coefficient multiplicateur selon son impact réel sur le quotidien des habitants :
- Agressions (Atteintes physiques et sexuelles) : Coefficient 3 (Critère majeur, intégrité des personnes).
- Cambriolages (Logements et commerces) : Coefficient 2 (Violation de l'intimité du domicile).
- Vols et Dégradations (Petite délinquance) : Coefficient 1 (Incivilités et délinquance de proximité).
- Stupéfiants (Trafic et usage) : Coefficient 1 (Indicateur lié aux réseaux et à la santé publique).
Les catégories d'infractions sont un regroupement des suivantes :
2. Le calcul des sous-notes sur 10
Pour chaque catégorie, le système calcule directement une note sur 10 avec la formule suivante :
Sous-note = 10 - 5 x (Valeur Ville / Valeur Référence Nationale)
Le principe est très simple : toutes les communes partent avec la note maximale de 10/10. On leur retire ensuite des points selon leur niveau de délinquance :
- Une ville sans aucun crime garde son 10/10.
- Une ville pile dans la moyenne nationale perd 5 points et obtient 5/10.
- Une ville qui atteint le double de la moyenne nationale perd 10 points et tombe à 0/10.
3. Note globale et mention officielle
L'Indice de Tranquillité final est la moyenne pondérée des 4 sous-notes. Elle détermine la mention de la commune :
| Note finale globale sur 10 | Mention affichée |
|---|---|
| De 8.5 à 10 / 10 | Optimale |
| De 6.5 à 8.4 / 10 | Favorable |
| De 3.5 à 6.4 / 10 | Contrastée |
| De 1.5 à 3.4 / 10 | Dégradée |
| Moins de 1.5 / 10 | Critique |
Exemple concret : Le calcul pour Harbonnières
L'analyse se base sur les indicateurs officiels de référence nationale :
- Agressions : Taux de 47 (Moyenne : 16,02) : 10 - 5 x (47 / 16,02) = 8,2 / 10 (Coeff 3)
- Cambriolages : Taux de 0 (Moyenne : 4,98) : 10 - 5 x (0 / 4,98) = 2,3 / 10 (Coeff 2)
- Vols et dégradations : Taux de 29 (Moyenne : 59,30) : 10 - 5 x (29 / 59,30) = 7,4 / 10 (Coeff 1)
- Stupéfiants : Taux de 0 (Moyenne : 17,07) : 10 - 5 x (0 / 17,07) = 10 / 10 (Coeff 1)
Calcul de l'Indice Global :
Note = ((47 x 3) + (0 x 2) + (29 x 1) + (0 x 1)) / 7 = 5.9 / 10
Avec une note de 5.9/10, la ville de Harbonnières se positionne dans la catégorie contrastée
Evolution du nombre d'infractions
Pour comparer(en proportion du nombre d'habitants)
La ville
Bilan sécurité 2026 : la ville de Harbonnières est-elle sûre ?
L'examen récent des indices de criminalité à Harbonnières révèle une situation contrastée. Le bilan est divisé entre des indicateurs de proximité préservés et des points noirs localisés.
- Atteintes à l'intégrité physique : Le volet des violences et agressions constitue un point de vigilance : l'indice de victimation local est supérieur aux moyennes nationales, marquant une tension sur la sécurité des personnes. 47 faits recensés en 2025, en hausse de 840 % sur un an.
- Cambriolages : La protection des domiciles est efficace : le taux de cambriolages de logements reste très inférieur à la moyenne, limitant l'exposition des résidents à ce risque. 0 effractions constatées en 2025, en diminution de 0 % sur un an.
- Vols et dégradations : La délinquance de proximité, incluant les vols et le vandalisme, est contenue. Les chiffres montrent une commune relativement épargnée par les dégradations urbaines. 29 infractions enregistrées en 2025, en augmentation de 107.1 % sur un an.
- Stupéfiants : La lutte contre les stupéfiants présente des résultats probants : l'activité liée au trafic et à l'usage est quasi absente des registres officiels de la commune. 0 signalements en 2025, marquant une atténuation de 0 % sur un an.
Sources : Bases statistiques communale, départementale et régionale de la délinquance enregistrée par la police et la gendarmerie nationales selon les dernières parutions officielles de 2026 portant sur l'année 2025 (data.gouv).
Services à la population
Commerce |
|
|---|---|
|
Hypermarché Chaulnes 11km |
|
|
Supermarché Rosières-en-Santerre 4km |
|
| Supérette | 1 |
|
Boulangerie Rosières-en-Santerre 5km |
|
|
Boucherie Rosières-en-Santerre 5km |
|
| Restaurant | 1 |
|
Garage Vauvillers 3km |
|
|
Station-service Rosières-en-Santerre 5km |
|
|
Banque Rosières-en-Santerre 5km |
|
|
La poste Caix 4km |
|
| Coiffeur | 1 |
|
Tabac Corbie 13km |
|
|
Bars / discothèque Rosières-en-Santerre 5km |
|
|
Bibliothèque Glisy 20km |
|
|
Cinéma Albert 17km |
|
|
Vétérinaire Rosières-en-Santerre 4km |
|
Santé |
|
|---|---|
| Pharmacie | 1 |
|
Hôpital Corbie 13km |
|
|
Laboratoire d'analyses médicales Estrées-Deniécourt 12km |
|
| Etablissement pour handicapé | 2 |
|
EHPA Caix 4km |
|
| Médecin | 2 |
|
Dentiste Rosières-en-Santerre 5km |
|
|
Chirurgien Villers-Bretonneux 11km |
|
|
Dermatologue Estrées-Deniécourt 12km |
|
|
Anesthésiste Amiens 27km |
|
|
Gastro-entérologue Amiens 25km |
|
|
Gynécologue Amiens 26km |
|
|
Cancérologue Amiens 27km |
|
|
Neurologue Amiens 26km |
|
|
Ophtalmologue Albert 17km |
|
|
ORL Chaulnes 10km |
|
|
Cardiologue Albert 17km |
|
|
Pédiatre Amiens 24km |
|
|
Pneumologue Villers-Bretonneux 11km |
|
|
Psychologue Péronne 21km |
|
|
Radiologue Moreuil 16km |
|
|
Rhumatologue Albert 17km |
|
|
Sage-femme Rosières-en-Santerre 5km |
|
Éducation |
|
|---|---|
| Crèche | 1 |
|
Ecole maternelle Public Rosières-en-Santerre 5km |
|
|
Ecole maternelle Privé Amiens 27km |
|
| Ecole primaire Public | 1 |
|
Ecole primaire Privé Rosières-en-Santerre 5km |
|
|
Collège Public Rosières-en-Santerre 4km |
|
|
Collège Privé Corbie 13km |
|
|
Lycée Public Albert 17km |
|
|
Lycée Privé Corbie 13km |
|
Bon à savoir :
- La ville ne possède pas de grands magasins alimentaire.
- La ville compte 1 médecin pour 820 habitants.
Sources : Base Sirene des entreprises et de leurs établissements selon les dernières parutions officielles de 2025 portant sur l'année 2024 (data.gouv). Liste, localisation et tarifs des professionnels de santé selon les dernières parutions officielles de 2025 portant sur l'année 2024 (opendatasoft) et FINESS Extraction du Fichier des établissements selon les dernières parutions officielles de 2025 portant sur l'année 2024 (data.gouv). Adresse et géolocalisation des établissements d'enseignement du premier et second degrés selon les dernières parutions officielles de 2025 portant sur l'année 2024 (data.education.gouv)
Carte et superficie
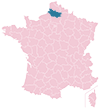
Carte de la ville de Harbonnières
Bon à savoir :
- Harbonnières est rattachée aux collectivités territoriales de la région Hauts-de-France, du département Somme
- Le code postal de Harbonnières est 80131.
- Harbonnières s'étend sur une superficie de 15 km². Classement
- Les villes voisines les plus proches sont Vauvillers, Guillaucourt, Bayonvillers, Framerville-Rainecourt et Wiencourt-l'Équipée

Toutes les cartes du 80
Mairie de Harbonnières
Mme Georgette SCIASCIA
Maire de Harbonnières
Maire de Harbonnières
Heures d'ouvertures
Lundi : 09:00-12:00Mardi : 09:00-12:00
Mercredi : Fermé
Jeudi : 09:00-12:00 14:00-17:00
Vendredi : 09:00-12:00 14:00-17:00
Samedi : Fermé
Dimanche : Fermé
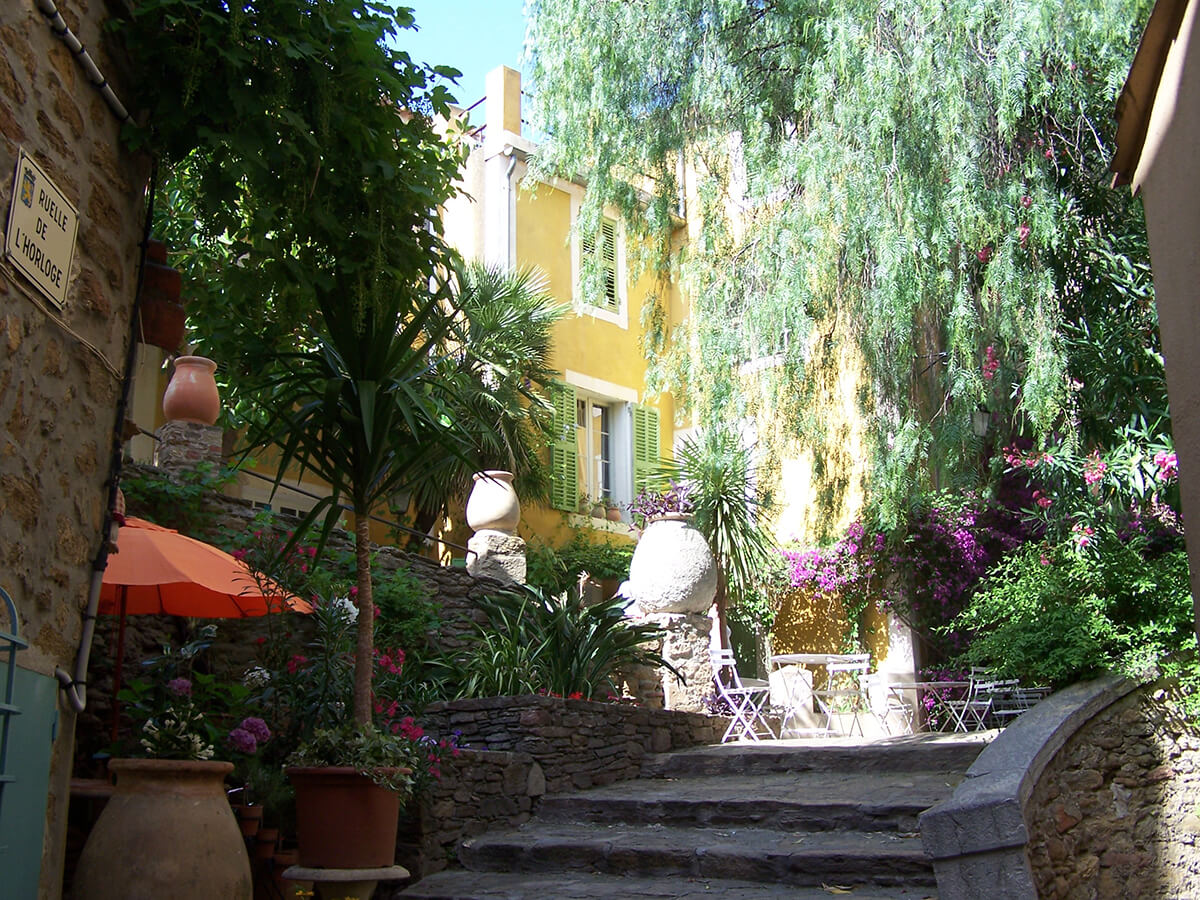
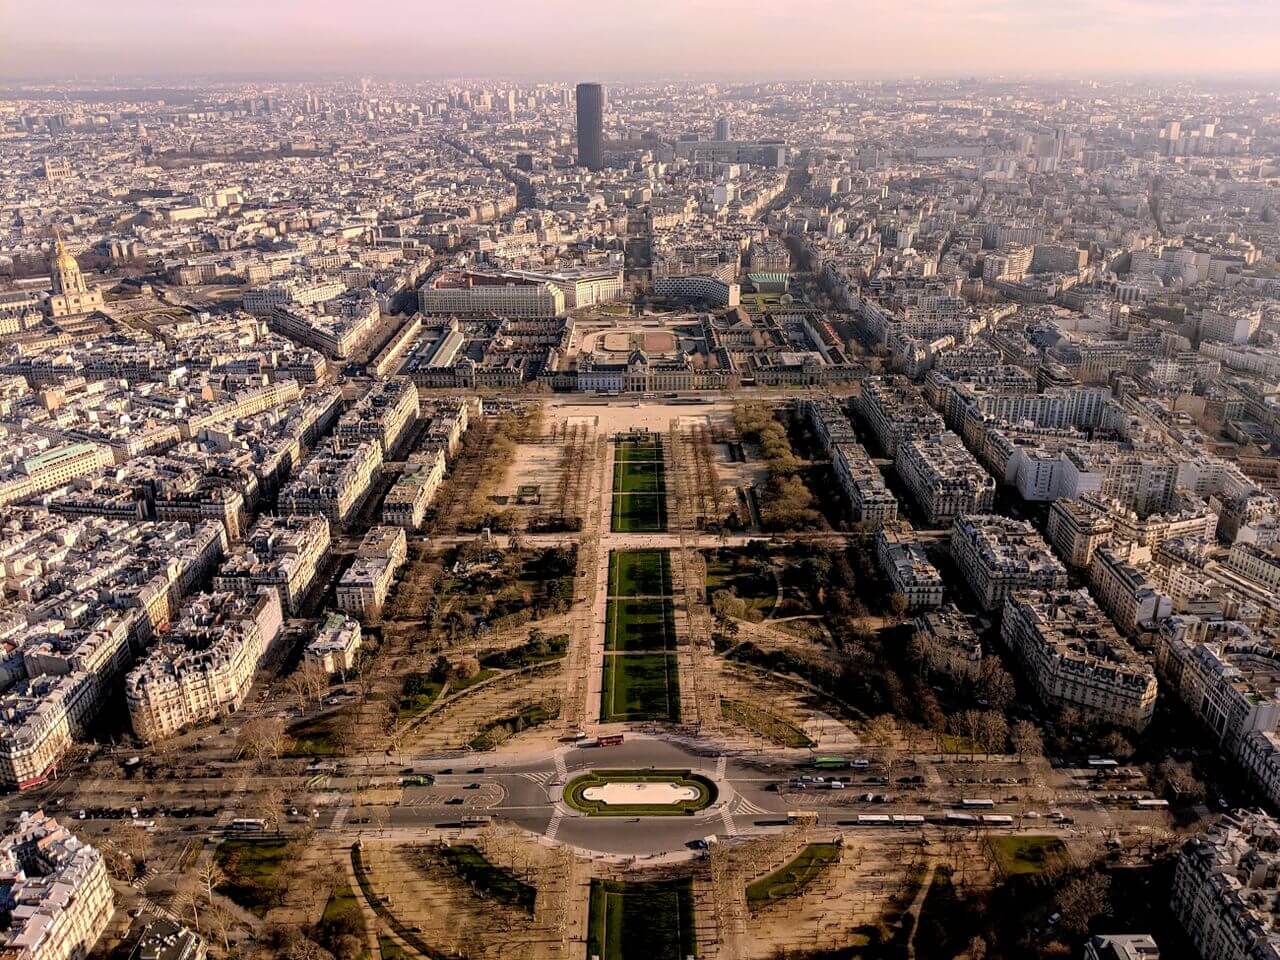
Photos de Harbonnières

Villes autour de Harbonnières
| Ville | Habitants | Superficie | Pop densité | Pop active | Taux chômage | Revenu moyen | Prix immobilier | Note globale |
|---|---|---|---|---|---|---|---|---|
| Statistiques Vauvillers | 233 | 6 km² | 39 h/km² | 52.8% | 3.4% | 22 230 €/an | 1 593 €/m² | - |
| Statistiques Guillaucourt | 386 | 6 km² | 64 h/km² | 55.2% | 7.5% | 22 310 €/an | 998 €/m² | - |
| Statistiques Bayonvillers | 340 | 8 km² | 43 h/km² | 50% | 4.7% | 21 910 €/an | 1 207 €/m² | - |
| Statistiques Framerville-Rainecourt | 443 | 9 km² | 49 h/km² | 54.6% | 4.3% | 22 630 €/an | 1 564 €/m² | - |
| Statistiques Wiencourt-l'Équipée | 249 | 5 km² | 50 h/km² | 57.8% | 7.2% | 23 200 €/an | 1 166 €/m² | - |
| Statistiques Morcourt | 327 | 7 km² | 47 h/km² | 53.5% | 7.6% | 20 700 €/an | 1 208 €/m² | - |
| Statistiques Caix | 704 | 12 km² | 59 h/km² | 45.2% | 6.1% | 21 960 €/an | 1 329 €/m² | 2.2 |
| Statistiques Proyart | 761 | 9 km² | 85 h/km² | 48.9% | 4.9% | 21 870 €/an | 1 158 €/m² | - |
| Statistiques Rosières-en-Santerre | 2 894 | 13 km² | 223 h/km² | 43% | 7.2% | 19 950 €/an | 1 312 €/m² | 3.6 |
| Statistiques Lamotte-Warfusée | 725 | 9 km² | 81 h/km² | 51.6% | 5% | 23 640 €/an | 1 787 €/m² | - |
| Statistiques Herleville | 192 | 6 km² | 32 h/km² | 50.5% | 7.3% | 24 000 €/an | 1 186 €/m² | - |
| Statistiques Cayeux-en-Santerre | 123 | 5 km² | 25 h/km² | 50.4% | 6.5% | 22 600 €/an | 1 028 €/m² | - |
| Statistiques Cerisy | 526 | 10 km² | 53 h/km² | 50.2% | 7.2% | 20 750 €/an | 1 282 €/m² | - |
| Statistiques Marcelcave | 1 302 | 12 km² | 109 h/km² | 49.1% | 3.1% | 23 690 €/an | 2 119 €/m² | 3.4 |
| Statistiques Chuignolles | 147 | 4 km² | 37 h/km² | 51.7% | 5.4% | 23 820 €/an | 1 655 €/m² | - |
Articles en relation
Acteur de l'économie locale :Faites découvrir vos services à Harbonnières


Signalement de photo
Merci ! Votre signalement est envoyé !
Ajouter une photo de Harbonnières
Merci ! Votre photo sera diffusée sur le site après modération.