


Signalement de photo
Merci ! Votre signalement est envoyé !
Quel est le nombre d'habitants à Chignin ? Dans quel département et dans quelle région se situe la ville ? Quelle est sa superficie ?
Quels sont les chiffres de la délinquance ?
Découvrez sur cette page toutes les informations essentielles sur la population, la sécurité, les services et l'immobilier à Chignin.
NOUVEAU : Rues sales, dépôts sauvages, dégradations urbaines. Faites votre signalement anonyme, nous nous chargeons de prévenir les autorités compétentes.
| Nombre d'habitants | 924 | Classement |
| Age moyen | 42 ans | Classement |
| Pop active | 47.8% | Classement |
| Taux chômage | 3.2% | Classement |
| Pop densité | 116 h/km² | Classement |
| Revenu moyen | 26 380 €/an | Classement |
| Agressions physiques / sexuelles | 0 |
| Cambriolages | 0 |
| Vols / dégradations | 0 |
| Stupéfiants | 0 |
Achat / Vente / Location Votre agence immobilière à Chignin
| Prix moyen | 350 583 € | Prix moyen au m² | 2 498 € |
| Prix moyen | 151 742 € | Prix moyen au m² | 2 146 € |
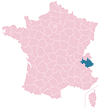
Carte de la ville de Chignin

Commerce |
|
|---|---|
|
Hypermarché (5km) La Ravoire |
|
|
Supermarché (2km) Porte-de-Savoie |
|
|
Boulangerie (2km) Porte-de-Savoie |
|
|
Boucherie (2km) Porte-de-Savoie |
|
|
Station-service (2km) Porte-de-Savoie |
|
|
Banque (4km) Montmélian |
|
|
La poste (4km) Montmélian |
|
| Coiffeur | 1 |
|
Vétérinaire (4km) Montmélian |
|
| Restaurant | 1 |
Santé |
|
|---|---|
|
Médecin (2km) Porte-de-Savoie |
|
|
Dentiste (2km) Porte-de-Savoie |
|
|
Pharmacie (2km) Porte-de-Savoie |
|
Éducation |
|
|---|---|
| Maternelle | 1 |
| Primaire | 1 |
|
Collège (4km) Montmélian |
|
|
Lycée (4km) Montmélian |
|


NOUVEAU : Décharges sauvages, détritus, objets abandonnés, graffitis, nids-de-poule : Déclarer un incident à Chignin


 Emmanuel MACRON
 Marine LE PEN
 Jean-Luc MÉLENCHON
 Éric ZEMMOUR
 Valérie PÉCRESSE
 Yannick JADOT
 Jean LASSALLE
 Fabien ROUSSEL
 Nicolas DUPONT-AIGNAN
 Anne HIDALGO
 Philippe POUTOU
 Nathalie ARTHAUDEmmanuel MACRONMarine LE PEN
| Ville | Habitants | Superficie | Pop densité | Pop active | Taux chômage | Revenu moyen | Prix immobilier | Note globale |
|---|---|---|---|---|---|---|---|---|
| Statistiques Porte-de-Savoie | 3 887 | 22 km² | 177 h/km² | 49.9% | 2.7% | 27 220 €/an | 3 304 €/m² | 4.8 |
| Statistiques Myans | 1 290 | 4 km² | 323 h/km² | 50.2% | 3% | 27 530 €/an | 2 973 €/m² | 3.2 |
| Statistiques La Thuile | 342 | 18 km² | 19 h/km² | 48% | 4.7% | 25 460 €/an | 1 833 €/m² | - |
| Statistiques Saint-Jeoire-Prieuré | 1 931 | 5 km² | 386 h/km² | 53% | 4.1% | 26 270 €/an | 3 366 €/m² | - |
| Statistiques Montmélian | 4 058 | 6 km² | 676 h/km² | 47.1% | 6.6% | 21 010 €/an | 2 139 €/m² | 3.5 |
| Statistiques Arbin | 791 | 2 km² | 396 h/km² | 42.5% | 2.7% | 26 440 €/an | 2 492 €/m² | 3.0 |
| Statistiques Challes-les-Eaux | 5 617 | 6 km² | 936 h/km² | 49% | 3.8% | 26 880 €/an | 2 961 €/m² | 4.2 |
| Statistiques La Chavanne | 733 | 3 km² | 244 h/km² | 55.8% | 1.9% | 28 570 €/an | 3 082 €/m² | 4.2 |
| Statistiques Cruet | 1 044 | 10 km² | 104 h/km² | 46.8% | 2.4% | 26 450 €/an | 2 696 €/m² | - |
| Statistiques La Ravoire | 9 042 | 7 km² | 1 292 h/km² | 47.3% | 4.9% | 24 520 €/an | 2 503 €/m² | 4.0 |
| Statistiques Sainte-Hélène-du-Lac | 816 | 7 km² | 117 h/km² | 48.4% | 4% | 27 590 €/an | 2 165 €/m² | - |
| Statistiques Saint-Baldoph | 2 706 | 6 km² | 451 h/km² | 47.6% | 2.6% | 28 510 €/an | 2 839 €/m² | - |
| Statistiques Planaise | 557 | 4 km² | 139 h/km² | 52.4% | 3.4% | 26 730 €/an | 1 877 €/m² | - |
| Statistiques Apremont | 972 | 18 km² | 54 h/km² | 48% | 2.6% | 27 120 €/an | 4 975 €/m² | - |
| Statistiques Puygros | 371 | 10 km² | 37 h/km² | 49.3% | 1.6% | 26 000 €/an | 2 490 €/m² | - |