


Signalement de photo
Merci ! Votre signalement est envoyé !
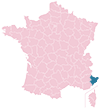
Quel est le nombre d'habitants à Carros ? Dans quel département et dans quelle région se situe la ville ? Quelle est sa superficie ?
Quels sont les chiffres de la délinquance ?
Découvrez sur cette page toutes les informations essentielles sur la population, la sécurité, les services et l'immobilier à Carros.
NOUVEAU : Rues sales, dépôts sauvages, dégradations urbaines. Faites votre signalement anonyme, nous nous chargeons de prévenir les autorités compétentes.
| Nombre d'habitants | 13 277 | Classement |
| Age moyen | 39 ans | Classement |
| Pop active | 45.7% | Classement |
| Taux chômage | 6.1% | Classement |
| Pop densité | 885 h/km² | Classement |
| Revenu moyen | 23 480 €/an | Classement |
| Agressions physiques / sexuelles | 142 |
| Cambriolages | 14 |
| Vols / dégradations | 203 |
| Stupéfiants | 83 |
Achat / Vente / Location Votre agence immobilière à Carros
| Prix moyen | 322 385 € | Prix moyen au m² | 2 982 € |
| Prix moyen | 190 589 € | Prix moyen au m² | 3 075 € |
Carte de la ville de Carros

Commerce |
|
|---|---|
|
Hypermarché (11km) Vence |
|
| Supermarché | 1 |
| Boulangerie | 5 |
| Boucherie | 3 |
| Station-service | 1 |
| Banque | 6 |
| La poste | 1 |
| Coiffeur | 21 |
| Vétérinaire | 5 |
| Restaurant | 48 |
Santé |
|
|---|---|
| Médecin | 26 |
| Dentiste | 6 |
| Pharmacie | 11 |
Éducation |
|
|---|---|
| Maternelle | 6 |
| Primaire | 5 |
| Collège | 1 |
|
Lycée (11km) Vence |
|


NOUVEAU : Décharges sauvages, détritus, objets abandonnés, graffitis, nids-de-poule : Déclarer un incident à Carros


 Marine LE PEN
 Jean-Luc MÉLENCHON
 Emmanuel MACRON
 Éric ZEMMOUR
 Yannick JADOT
 Valérie PÉCRESSE
 Nicolas DUPONT-AIGNAN
 Jean LASSALLE
 Fabien ROUSSEL
 Anne HIDALGO
 Philippe POUTOU
 Nathalie ARTHAUDEmmanuel MACRONMarine LE PEN
| Ville | Habitants | Superficie | Pop densité | Pop active | Taux chômage | Revenu moyen | Prix immobilier | Note globale |
|---|---|---|---|---|---|---|---|---|
| Statistiques Le Broc | 1 422 | 19 km² | 75 h/km² | 50.6% | 4.4% | 25 230 €/an | 3 018 €/m² | - |
| Statistiques Saint-Martin-du-Var | 3 375 | 6 km² | 563 h/km² | 46.9% | 4.1% | 24 210 €/an | 3 003 €/m² | 3.5 |
| Statistiques Gattières | 4 287 | 10 km² | 429 h/km² | 45.5% | 3% | 27 110 €/an | 3 181 €/m² | 3.1 |
| Statistiques La Roquette-sur-Var | 945 | 4 km² | 236 h/km² | 48.4% | 5.7% | 23 460 €/an | 2 565 €/m² | - |
| Statistiques Castagniers | 1 687 | 8 km² | 211 h/km² | 46.7% | 3.6% | 26 050 €/an | 4 318 €/m² | - |
| Statistiques Colomars | 3 487 | 7 km² | 498 h/km² | 47% | 3.6% | 28 750 €/an | 4 466 €/m² | 1.3 |
| Statistiques Saint-Blaise | 1 367 | 8 km² | 171 h/km² | 51.9% | 3.1% | 26 960 €/an | 2 812 €/m² | 3.2 |
| Statistiques Aspremont | 2 300 | 9 km² | 256 h/km² | 47% | 3.3% | 29 450 €/an | 3 974 €/m² | - |
| Statistiques Gilette | 1 608 | 10 km² | 161 h/km² | 49.5% | 5.5% | 24 760 €/an | 2 742 €/m² | 3.6 |
| Statistiques Saint-Jeannet | 4 303 | 15 km² | 287 h/km² | 46% | 4.3% | 27 840 €/an | 4 933 €/m² | 4.6 |
| Statistiques Bouyon | 543 | 12 km² | 45 h/km² | 52.7% | 5.2% | 22 720 €/an | 2 409 €/m² | - |
| Statistiques Bézaudun-les-Alpes | 258 | 21 km² | 12 h/km² | 51.2% | 3.9% | 21 280 €/an | 2 125 €/m² | - |
| Statistiques Tourrette-Levens | 4 760 | 17 km² | 280 h/km² | 47.3% | 3.5% | 26 240 €/an | 3 764 €/m² | 4.4 |
| Statistiques Bonson | 716 | 7 km² | 102 h/km² | 53.6% | 5.9% | 24 020 €/an | 2 636 €/m² | - |
| Statistiques Levens | 5 165 | 30 km² | 172 h/km² | 45.5% | 3.3% | 25 260 €/an | 3 427 €/m² | 3.8 |