


Signalement de photo
Merci ! Votre signalement est envoyé !
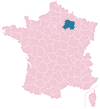
Quel est le nombre d'habitants à Bétheny ? Dans quel département et dans quelle région se situe la ville ? Quelle est sa superficie ?
Quels sont les chiffres de la délinquance ?
Découvrez sur cette page toutes les informations essentielles sur la population, la sécurité, les services et l'immobilier à Bétheny.
NOUVEAU : Rues sales, dépôts sauvages, dégradations urbaines. Faites votre signalement anonyme, nous nous chargeons de prévenir les autorités compétentes.
| Nombre d'habitants | 7 086 | Classement |
| Age moyen | 43 ans | Classement |
| Pop active | 44.1% | Classement |
| Taux chômage | 4.4% | Classement |
| Pop densité | 354 h/km² | Classement |
| Revenu moyen | 24 450 €/an | Classement |
| Agressions physiques / sexuelles | 64 |
| Cambriolages | 8 |
| Vols / dégradations | 124 |
| Stupéfiants | 0 |
Achat / Vente / Location Votre agence immobilière à Bétheny
| Prix moyen | 265 621 € | Prix moyen au m² | 2 585 € |
| Prix moyen | 118 818 € | Prix moyen au m² | 1 648 € |
Carte de la ville de Bétheny

Commerce |
|
|---|---|
|
Hypermarché (4km) Reims |
|
| Supermarché | 1 |
| Boulangerie | 3 |
| Boucherie | 1 |
|
Station-service (4km) Reims |
|
| Banque | 3 |
| La poste | 1 |
| Coiffeur | 6 |
| Vétérinaire | 1 |
| Restaurant | 10 |
Santé |
|
|---|---|
| Médecin | 8 |
| Dentiste | 5 |
| Pharmacie | 3 |


NOUVEAU : Décharges sauvages, détritus, objets abandonnés, graffitis, nids-de-poule : Déclarer un incident à Bétheny


 Emmanuel MACRON
 Marine LE PEN
 Jean-Luc MÉLENCHON
 Éric ZEMMOUR
 Valérie PÉCRESSE
 Yannick JADOT
 Nicolas DUPONT-AIGNAN
 Fabien ROUSSEL
 Jean LASSALLE
 Anne HIDALGO
 Philippe POUTOU
 Nathalie ARTHAUDEmmanuel MACRONMarine LE PEN
| Ville | Habitants | Superficie | Pop densité | Pop active | Taux chômage | Revenu moyen | Prix immobilier | Note globale |
|---|---|---|---|---|---|---|---|---|
| Statistiques Reims | 179 380 | 47 km² | 3 817 h/km² | 46.1% | 8.3% | 20 210 €/an | 2 303 €/m² | 3.3 |
| Statistiques Cernay-lès-Reims | 1 508 | 16 km² | 94 h/km² | 39.6% | 2.5% | 31 910 €/an | 2 167 €/m² | 5.0 |
| Statistiques Witry-lès-Reims | 4 940 | 16 km² | 309 h/km² | 47.7% | 3.3% | 24 990 €/an | 2 092 €/m² | 3.8 |
| Statistiques Courcy | 1 247 | 16 km² | 78 h/km² | 47.5% | 3.2% | 26 230 €/an | 2 102 €/m² | - |
| Statistiques Saint-Brice-Courcelles | 3 526 | 4 km² | 882 h/km² | 42.7% | 4% | 23 260 €/an | 2 289 €/m² | 5.0 |
| Statistiques Brimont | 453 | 13 km² | 35 h/km² | 50.1% | 3.5% | 27 240 €/an | 2 291 €/m² | - |
| Statistiques Tinqueux | 10 552 | 4 km² | 2 638 h/km² | 44.2% | 4.4% | 23 810 €/an | 2 354 €/m² | 3.5 |
| Statistiques Champigny | 1 586 | 4 km² | 397 h/km² | 48.9% | 5.1% | 28 970 €/an | 2 611 €/m² | 4.0 |
| Statistiques Saint-Thierry | 602 | 8 km² | 75 h/km² | 46% | 2.8% | 29 720 €/an | 3 146 €/m² | - |
| Statistiques Thil | 312 | 2 km² | 156 h/km² | 43.3% | 2.9% | 28 340 €/an | 2 236 €/m² | - |
| Statistiques Cormontreuil | 6 456 | 5 km² | 1 291 h/km² | 40.3% | 3.4% | 26 120 €/an | 2 695 €/m² | 3.2 |
| Statistiques Berru | 609 | 14 km² | 44 h/km² | 52.5% | 3.4% | 28 810 €/an | 2 565 €/m² | 1.4 |
| Statistiques Merfy | 598 | 7 km² | 85 h/km² | 48% | 4.3% | 30 160 €/an | 1 824 €/m² | - |
| Statistiques Caurel | 695 | 10 km² | 70 h/km² | 45.3% | 2.3% | 29 120 €/an | 2 179 €/m² | - |
| Statistiques Bourgogne-Fresne | 1 442 | 27 km² | 53 h/km² | 44.7% | 2.6% | 27 070 €/an | 1 893 €/m² | - |