


Signalement de photo
Merci ! Votre signalement est envoyé !
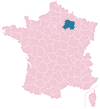
Quel est le nombre d'habitants à Baye ? Dans quel département et dans quelle région se situe la ville ? Quelle est sa superficie ?
Quels sont les chiffres de la délinquance ?
Découvrez sur cette page toutes les informations essentielles sur la population, la sécurité, les services et l'immobilier à Baye.
NOUVEAU : Rues sales, dépôts sauvages, dégradations urbaines. Faites votre signalement anonyme, nous nous chargeons de prévenir les autorités compétentes.
| Nombre d'habitants | 386 | Classement |
| Age moyen | 46 ans | Classement |
| Pop active | 42% | Classement |
| Taux chômage | 3.4% | Classement |
| Pop densité | 21 h/km² | Classement |
| Revenu moyen | 21 420 €/an | Classement |
| Agressions physiques / sexuelles | 0 |
| Cambriolages | 0 |
| Vols / dégradations | 0 |
| Stupéfiants | 0 |
Achat / Vente / Location Votre agence immobilière à Baye
| Prix moyen | 94 885 € | Prix moyen au m² | 953 € |
| Prix moyen | 30 000 € | Prix moyen au m² | 250 € |
Carte de la ville de Baye

Commerce |
|
|---|---|
|
Hypermarché (22km) Pierry |
|
|
Supermarché (15km) Sézanne |
|
| Boulangerie | 1 |
|
Boucherie (7km) Fromentières |
|
|
Station-service (15km) Moeurs-Verdey |
|
|
Banque (9km) Montmort-Lucy |
|
|
La poste (7km) Étoges |
|
|
Coiffeur (4km) Champaubert |
|
|
Vétérinaire (9km) Montmort-Lucy |
|
|
Restaurant (3km) Villevenard |
|
Santé |
|
|---|---|
|
Médecin (7km) Étoges |
|
|
Dentiste (9km) Montmort-Lucy |
|
|
Pharmacie (7km) Étoges |
|
Éducation |
|
|---|---|
|
Maternelle (5km) Congy |
|
|
Primaire (5km) Congy |
|
|
Collège (9km) Montmort-Lucy |
|
|
Lycée (15km) Sézanne |
|


NOUVEAU : Décharges sauvages, détritus, objets abandonnés, graffitis, nids-de-poule : Déclarer un incident à Baye


 Emmanuel MACRON
 Marine LE PEN
 Valérie PÉCRESSE
 Jean-Luc MÉLENCHON
 Nicolas DUPONT-AIGNAN
 Éric ZEMMOUR
 Jean LASSALLE
 Fabien ROUSSEL
 Anne HIDALGO
 Nathalie ARTHAUD
 Yannick JADOT
 Philippe POUTOUEmmanuel MACRONMarine LE PEN
| Ville | Habitants | Superficie | Pop densité | Pop active | Taux chômage | Revenu moyen | Prix immobilier | Note globale |
|---|---|---|---|---|---|---|---|---|
| Statistiques Talus-Saint-Prix | 102 | 6 km² | 17 h/km² | 50% | 5.9% | NC | 1 263 €/m² | - |
| Statistiques Bannay | 22 | 7 km² | 3 h/km² | 40.9% | 4.5% | NC | 1 250 €/m² | - |
| Statistiques Villevenard | 196 | 13 km² | 15 h/km² | 48.5% | 2% | 26 230 €/an | 2 236 €/m² | - |
| Statistiques Champaubert | 122 | 13 km² | 9 h/km² | 46.7% | 2.5% | 22 510 €/an | 1 194 €/m² | - |
| Statistiques Oyes | 107 | 8 km² | 13 h/km² | 46.7% | 3.7% | NC | NC | - |
| Statistiques Soizy-aux-Bois | 191 | 7 km² | 27 h/km² | 45.5% | 3.1% | 22 950 €/an | 1 658 €/m² | - |
| Statistiques Congy | 260 | 17 km² | 15 h/km² | 50.8% | 3.1% | 25 810 €/an | 1 228 €/m² | - |
| Statistiques Courjeonnet | 48 | 6 km² | 8 h/km² | 41.7% | 6.3% | NC | NC | - |
| Statistiques Corfélix | 110 | 8 km² | 14 h/km² | 56.4% | 6.4% | 23 480 €/an | 875 €/m² | - |
| Statistiques Reuves | 61 | 6 km² | 10 h/km² | 36.1% | 1.6% | NC | 1 278 €/m² | - |
| Statistiques Le Thoult-Trosnay | 106 | 15 km² | 7 h/km² | 44.3% | 1.9% | NC | 1 330 €/m² | - |
| Statistiques Fèrebrianges | 145 | 7 km² | 21 h/km² | 54.5% | 0.7% | 26 540 €/an | 1 664 €/m² | - |
| Statistiques Fromentières | 377 | 9 km² | 42 h/km² | 53.3% | 4% | 23 160 €/an | 1 140 €/m² | - |
| Statistiques La Villeneuve-lès-Charleville | 120 | 11 km² | 11 h/km² | 60.8% | 3.3% | 24 690 €/an | 1 675 €/m² | - |
| Statistiques Étoges | 441 | 15 km² | 29 h/km² | 51% | 2.7% | 23 660 €/an | 1 630 €/m² | 3.2 |