
Bienvenue à Auch, ville du département du Gers en région Occitanie. Comptabilisant aujourd'hui 22 428 habitants, la ville évolue en s'adaptant aux réalités de son territoire et aux besoins de sa population sous la gestion de son maire Camille BONNE.
Présentation

Statistiques sur la population
Quel est le profil de la population, sa situation démographique ?
| Nombre d'habitants | 22 428 | Classement |
|---|---|---|
| Age moyen | 45 ans | Classement |
| Pop active | 43.3% | Classement |
| Taux chômage | 10.5% | Classement |
| Pop densité | 312 h/km² | Classement |
| Revenu moyen | 21 800 €/an | Classement |
Evolution du nombre d'habitants
Aujourd'hui, en 2026, la population de Auch est estimée à 23 185 habitants selon un modèle de régression linéaire appliqué aux dix dernières années. (23 060 en 2025).
Les derniers chiffres officiels publiés par la source INSEE en 2026 portent sur la population de 2023 qui enregistre une baisse de 1.8% sur un an.
Les derniers chiffres officiels publiés par la source INSEE en 2026 portent sur la population de 2023 qui enregistre une baisse de 1.8% sur un an.
Tranche d'âge


0-14 ans
14%

15-29 ans
18%

30-44 ans
15%

45-59 ans
20%

60-74 ans
19%

75-89 ans
12%

90 ans et +
2%
Activité professionnelle


Agriculteurs
0%

Artisans, Commerçants
2%

Cadres et sup.
6%

Professions intermédiaires
11%

Employé
14%

Ouvrier
9%

Retraité
29%

Autres
16%
Niveau de diplôme


Sans diplôme ou CEP
21%

Brevet, BEPC, DNB
7%

CAP-BEP ou équivalent
23%

BAC ou équivalent
19%

BAC+2
10%

BAC+3 ou +4
11%

BAC+5 ou plus
9%
Composition des ménages


Couple sans enfant
33%

Couple avec enfant(s)
20%

Famille monoparentale
7%

Colocation / Autre
3%

Personnes seules
37%
Profils électoraux
Quels sont les résultats des dernières élections aux présidentiels 2022 ?
Premier tour
 Emmanuel MACRON
27.45 %
 Jean-Luc MÉLENCHON
25.59 %
 Marine LE PEN
16.04 %
 Jean LASSALLE
6.29 %
 Éric ZEMMOUR
6.21 %
 Anne HIDALGO
4.63 %
 Yannick JADOT
4.33 %
 Valérie PÉCRESSE
3.80 %
 Fabien ROUSSEL
3.10 %
 Nicolas DUPONT-AIGNAN
1.55 %
 Philippe POUTOU
0.67 %
 Nathalie ARTHAUD
0.34 %
14 392 inscrits
Participation : 75.4%
Votes blancs : 1.43%
Votes nuls : 0.63%
Participation : 75.4%
Votes blancs : 1.43%
Votes nuls : 0.63%
Second tour
Emmanuel MACRON67,43 %
Marine LE PEN32,57 %
14 383 inscrits
Participation : 71.97%
Votes blancs : 9.06%
Votes nuls : 3.52%
Participation : 71.97%
Votes blancs : 9.06%
Votes nuls : 3.52%
Bon à savoir :
- Le revenu moyen par habitant à Auch (21 800 €) est au dessus de la moyenne nationale (20 590 €).
- La part de la population au chômage (10.5%) est supérieure à la moyenne nationale (8%).
- Le taux de chômage indiqué est au sens du BIT qui se distingue du taux de chômage au sens du recensement de la population.
Sources : Institut national de la statistique et des études économiques (insee) selon Les dernières parutions officielles de 2025 portant sur les années 2020, 2021 et 2022.
Sécurité, faits divers : les chiffres de la délinquance
| Agressions physiques / sexuelles | 247 |
|---|---|
| Cambriolages | 69 |
| Vols / dégradations | 649 |
| Stupéfiants | 202 |
Evolution du nombre d'infractions
Pour comparer(en proportion du nombre d'habitants)
La ville
Bilan sécurité 2025 : la ville de Auch est-elle sûre ?
L'examen des indices de criminalité à Auch pour l'année 2025 révèle une situation dégradée. On observe une pression délinquante réelle : plusieurs indicateurs clés de la sécurité publique sont en zone de vigilance.
- Atteintes à l'intégrité physique : Sur le front des agressions physiques et sexuelles, Auch se situe dans la moyenne des villes françaises, sans décrochage notable par rapport aux statistiques de référence.
- Cambriolages : La ville fait face à une pression sur les cambriolages. Le nombre d'effractions de logements dépasse les indicateurs de référence, nécessitant une vigilance accrue des habitants.
- Vols et dégradations : On note une récurrence des faits de petite délinquance. Les indicateurs de vols et destructions volontaires sont supérieurs à la moyenne, pesant sur le sentiment de sécurité.
- Stupéfiants : La thématique des stupéfiants marque un point de tension : les faits de trafic ou d'usage recensés sont supérieurs aux seuils de référence nationaux.
Sources : Bases statistiques communale, départementale et régionale de la délinquance enregistrée par la police et la gendarmerie nationales selon les dernières parutions officielles de 2026 portant sur l'année 2025 (data.gouv).
Agressions physiques / sexuelles : Violences sexuelles, coups et blessures volontaires intrafamiliaux, coups et blessures volontaires, autres coups, blessures volontaires et vols violents sans arme.
Cambriolages : Cambriolages de logements.
Vols : Vols avec armes, vols d'accessoires sur véhicules, vols dans les véhicules, vols de véhicules, vols sans violence contre des personnes, destructions, dégradations volontaires et escroqueries.
Stupéfiants : Trafic de stupéfiants dont (AFD) et usage de stupéfiants.
Comparatif des quartiers
| Quartier | Habitants | Superficie | Pop densité | Pop active | Taux chômage | Revenu moyen | Note globale |
|---|---|---|---|---|---|---|---|
Auch Rural |
2 204 | 52.34 km² | 42 h/km² | 43% | 3.6% | 26 150 €/an | 4.2 |
Centre Ville |
3 681 | 0.79 km² | 4 659 h/km² | 46% | 8.2% | 17 270 €/an | 3.0 |
Faubourgs |
9 684 | 8.4 km² | 1 153 h/km² | 42.2% | 4.8% | 21 148 €/an | 4.4 |
Habitat Social |
2 994 | 0.54 km² | 5 544 h/km² | 38.7% | 13.4% | 10 765 €/an | 3.0 |
Zone d'Activité Quart Nord Est |
1 487 | 6.21 km² | 239 h/km² | 44.4% | 2.6% | 24 650 €/an | - |
Zone d'Activité Sud |
2 469 | 5.05 km² | 489 h/km² | 36.9% | 4.1% | 22 280 €/an | - |
Services à la population
Commerce |
|
|---|---|
| Hypermarché | 2 |
| Supermarché | 9 |
| Supérette | 20 |
| Boulangerie | 15 |
| Boucherie | 9 |
| Restaurant | 54 |
| Garage | 43 |
| Station-service | 6 |
| Banque | 21 |
| La poste | 92 |
| Coiffeur | 51 |
| Tabac | 6 |
| Bars / discothèque | 22 |
| Bibliothèque | 5 |
| Cinéma | 3 |
| Vétérinaire | 9 |
Santé |
|
|---|---|
| Pharmacie | 9 |
| Hôpital | 4 |
| Laboratoire d'analyses médicales | 3 |
| Etablissement pour handicapé | 14 |
| EHPA | 7 |
| Médecin | 18 |
| Dentiste | 22 |
| Chirurgien | 6 |
| Dermatologue | 1 |
|
Anesthésiste Fleurance 23km |
|
|
Gastro-entérologue Cornebarrieu 59km |
|
|
Gynécologue L'Isle-Jourdain 40km |
|
|
Cancérologue Cornebarrieu 59km |
|
| Neurologue | 1 |
| Ophtalmologue | 11 |
| ORL | 2 |
| Cardiologue | 4 |
|
Pédiatre Lectoure 32km |
|
| Pneumologue | 1 |
| Psychologue | 6 |
| Radiologue | 6 |
| Rhumatologue | 3 |
| Sage-femme | 3 |
Éducation |
|
|---|---|
| Crèche | 12 |
| Ecole maternelle Public | 7 |
|
Ecole maternelle Privé Plaisance-du-Touch 59km |
|
| Ecole primaire Public | 8 |
| Ecole primaire Privé | 1 |
| Collège Public | 3 |
| Collège Privé | 1 |
| Lycée Public | 4 |
| Lycée Privé | 2 |
Bon à savoir :
- La ville comptabilise de nombreux commerces divers et variés.
- La ville compte 1 médecin pour 1246 habitants.
- La ville dispose de tous les établissements scolaires public de l’école maternelle au lycée.
Sources : Base Sirene des entreprises et de leurs établissements selon les dernières parutions officielles de 2025 portant sur l'année 2024 (data.gouv). Liste, localisation et tarifs des professionnels de santé selon les dernières parutions officielles de 2025 portant sur l'année 2024 (opendatasoft) et FINESS Extraction du Fichier des établissements selon les dernières parutions officielles de 2025 portant sur l'année 2024 (data.gouv). Adresse et géolocalisation des établissements d'enseignement du premier et second degrés selon les dernières parutions officielles de 2025 portant sur l'année 2024 (data.education.gouv)
Carte et superficie
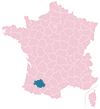
Carte de la ville de Auch
Bon à savoir :
- Auch est rattachée aux collectivités territoriales de la région Occitanie, du département Gers
- Le code postal de Auch est 32810.
- Auch s'étend sur une superficie de 72 km². Classement
- Les villes voisines les plus proches sont Duran, Pavie, Montégut, Pessan et Castin

Mairie de Auch
M. Camille BONNE
Maire de Auch
Maire de Auch
Adresse
1 place de la Libération BP 90321 32007 AuchContact
Heures d'ouvertures
Lundi : 08:00-17:00Mardi : 08:00-17:00
Mercredi : 08:00-17:00
Jeudi : 08:00-17:00
Vendredi : 08:00-17:00
Samedi : Fermé
Dimanche : Fermé
Photos de Auch
-
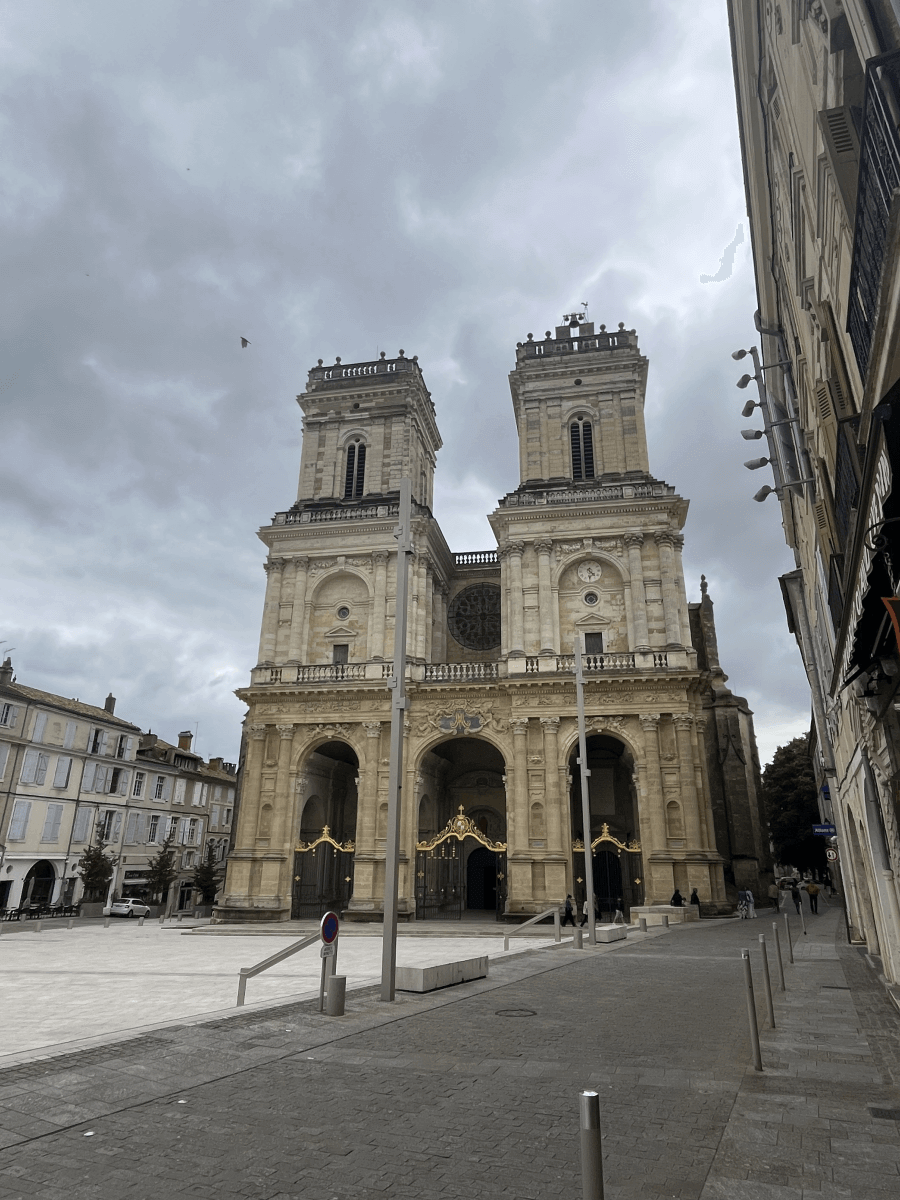
Cathédrale Sainte-Marie d'Auch
Auteur : Olivier
Villes autour de Auch
| Ville | Habitants | Superficie | Pop densité | Pop active | Taux chômage | Revenu moyen | Prix immobilier | Note globale |
|---|---|---|---|---|---|---|---|---|
| Statistiques Duran | 862 | 6 km² | 144 h/km² | 45.9% | 2.7% | 25 780 €/an | 1 835 €/m² | - |
| Statistiques Pavie | 2 566 | 24 km² | 107 h/km² | 41.9% | 4.4% | 24 250 €/an | 1 591 €/m² | - |
| Statistiques Montégut | 719 | 11 km² | 65 h/km² | 39.5% | 2.2% | 25 130 €/an | 1 919 €/m² | - |
| Statistiques Pessan | 648 | 26 km² | 25 h/km² | 46.1% | 2.2% | 23 820 €/an | 1 275 €/m² | - |
| Statistiques Castin | 337 | 11 km² | 31 h/km² | 49.3% | 2.7% | 25 610 €/an | 2 033 €/m² | - |
| Statistiques Leboulin | 346 | 8 km² | 43 h/km² | 48.3% | 2% | 28 650 €/an | 1 348 €/m² | - |
| Statistiques Lahitte | 235 | 5 km² | 47 h/km² | 43% | 1.7% | 27 190 €/an | 2 015 €/m² | - |
| Statistiques Lasseube-Propre | 337 | 14 km² | 24 h/km² | 51.6% | 0.9% | 26 140 €/an | 1 335 €/m² | - |
| Statistiques Roquelaure | 563 | 21 km² | 27 h/km² | 48.1% | 3.6% | 24 070 €/an | 1 236 €/m² | - |
| Statistiques Montaut-les-Créneaux | 697 | 26 km² | 27 h/km² | 45.9% | 2.4% | 25 080 €/an | 536 €/m² | - |
| Statistiques Auterive | 529 | 10 km² | 53 h/km² | 43.1% | 3.2% | 23 930 €/an | 1 576 €/m² | - |
| Statistiques Castillon-Massas | 222 | 9 km² | 25 h/km² | 47.7% | 1.8% | 23 340 €/an | 1 077 €/m² | - |
| Statistiques Preignan | 1 202 | 10 km² | 120 h/km² | 48.3% | 3.4% | 24 050 €/an | 1 446 €/m² | - |
| Statistiques Lasséran | 358 | 15 km² | 24 h/km² | 48% | 2% | 25 440 €/an | 1 789 €/m² | - |
| Statistiques Saint-Jean-le-Comtal | 381 | 17 km² | 22 h/km² | 51.4% | 3.7% | 24 560 €/an | 1 497 €/m² | - |
Articles en relation
Acteur de l'économie locale :Faites découvrir vos services à Auch


Signalement de photo
Merci ! Votre signalement est envoyé !
Ajouter une photo de Auch
Merci ! Votre photo sera diffusée sur le site après modération.