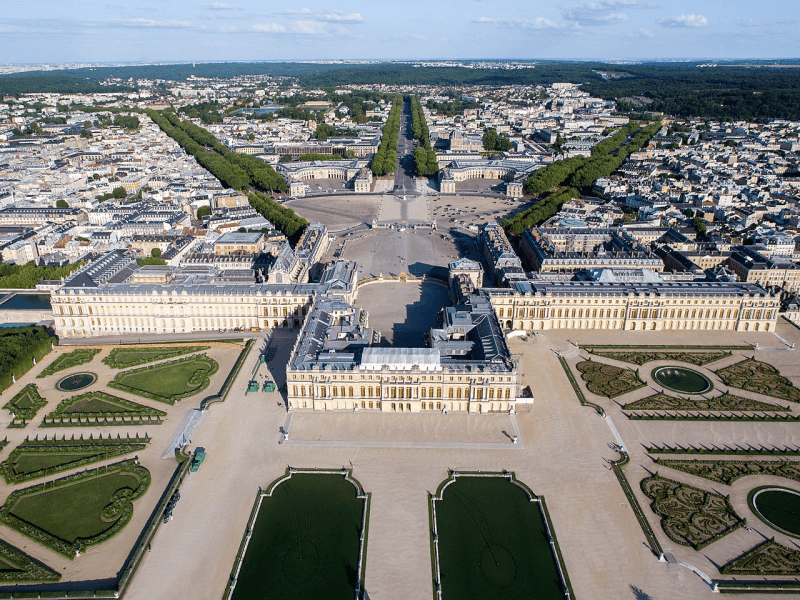
Château de Versailles
Auteur : ToucanWings

Château de Versailles
Auteur : ToucanWings
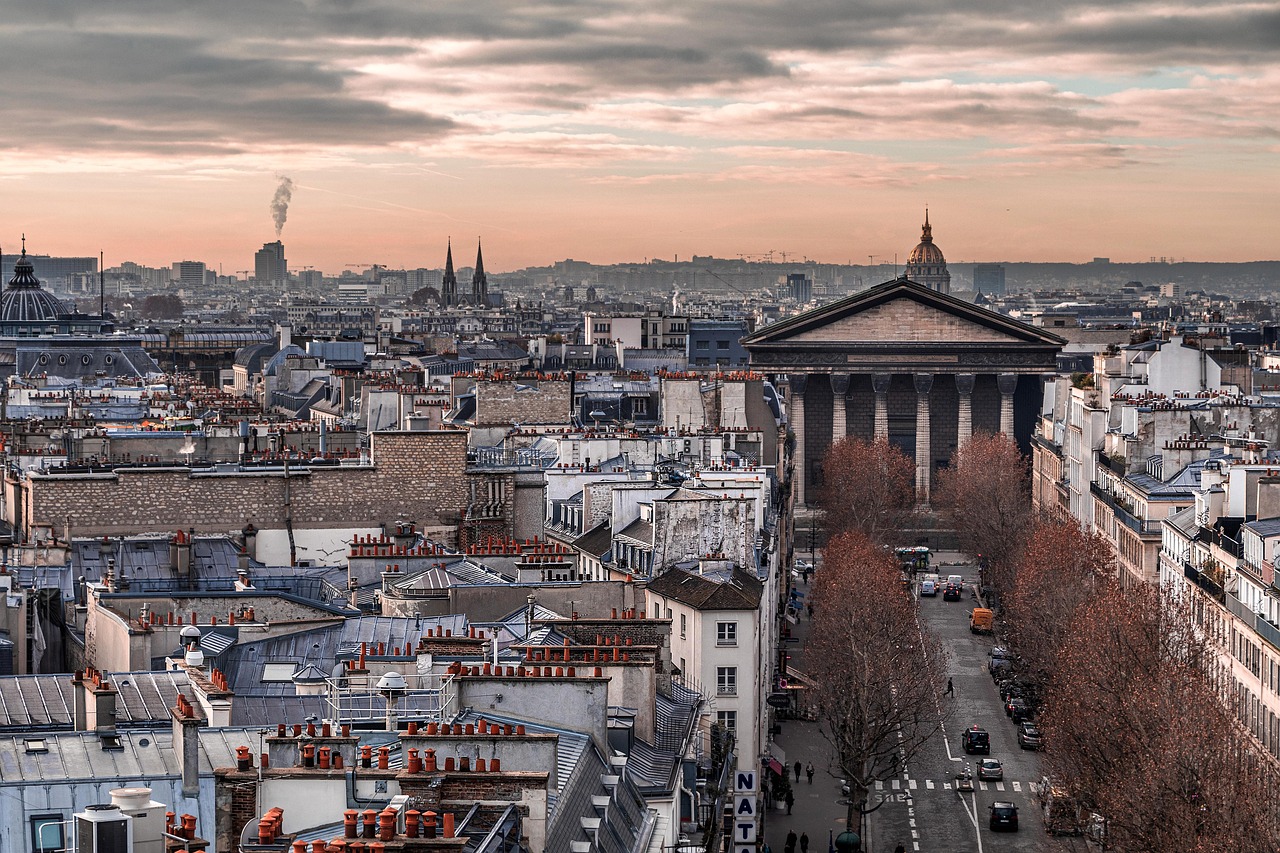
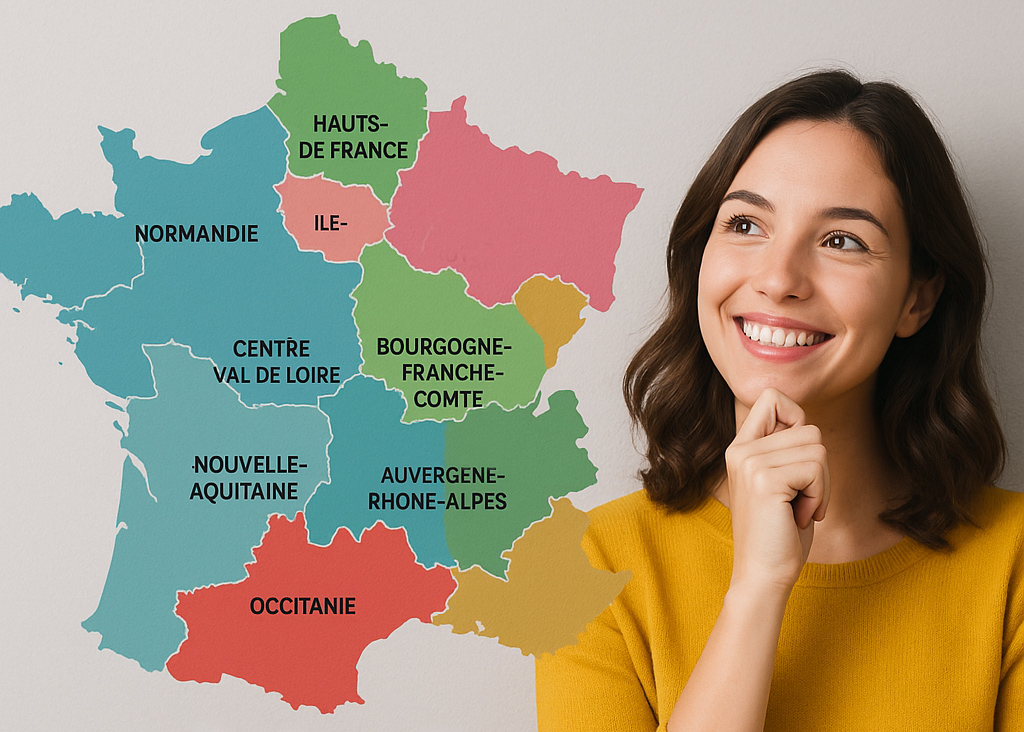
Bienvenue à Versailles, ville du département des Yvelines en région Île-de-France. Comptabilisant aujourd'hui 83 918 habitants, la ville évolue en s'adaptant aux réalités de son territoire et aux besoins de sa population sous la gestion de son maire François DE MAZIÈRES.
Profil de la population, situation sécuritaire, vie pratique : Petit tour d'horizon de Versailles pour mieux comprendre son développement et ses perspectives.
Quel est le profil de la population, sa situation démographique ?
| Nombre d'habitants | 83 918 | Classement |
|---|---|---|
| Age moyen | 40 ans | Classement |
| Pop active | 47.8% | Classement |
| Taux chômage | 5.8% | Classement |
| Pop densité | 3 228 h/km² | Classement |
| Revenu moyen | 33 780 €/an | Classement |


Quels sont les résultats des dernières élections aux présidentiels 2022 ?
 Emmanuel MACRON
 Éric ZEMMOUR
 Jean-Luc MÉLENCHON
 Valérie PÉCRESSE
 Marine LE PEN
 Yannick JADOT
 Jean LASSALLE
 Nicolas DUPONT-AIGNAN
 Fabien ROUSSEL
 Anne HIDALGO
 Philippe POUTOU
 Nathalie ARTHAUDEmmanuel MACRONMarine LE PEN
| Agressions physiques / sexuelles | 871 |
|---|---|
| Cambriolages | 216 |
| Vols / dégradations | 2 211 |
| Stupéfiants | 704 |
| Quartier | Habitants | Superficie | Pop densité | Pop active | Taux chômage | Revenu moyen | Note globale |
|---|---|---|---|---|---|---|---|
Chantiers |
18 264 | 3.55 km² | 5 145 h/km² | 50.3% | 3.8% | 33 958 €/an | 4.3 |
Clagny |
13 022 | 2.27 km² | 5 737 h/km² | 41.6% | 3% | 45 002 €/an | 4.7 |
Jussieu |
6 715 | 0.66 km² | 10 174 h/km² | 46.4% | 6.4% | 21 428 €/an | 3.1 |
Montreuil |
15 709 | 1.64 km² | 9 579 h/km² | 42% | 3.7% | 31 523 €/an | 4.5 |
Notre Dame |
16 052 | 1.47 km² | 10 920 h/km² | 48.1% | 3.3% | 45 347 €/an | 4.4 |
Saint-Louis Château |
13 820 | 16.55 km² | 835 h/km² | 58.4% | 4.2% | 31 748 €/an | 4.2 |
Commerce |
|
|---|---|
|
Hypermarché Le Chesnay-Rocquencourt 3km |
|
| Supermarché | 17 |
| Superêtte | 64 |
| Boulangerie | 42 |
| Boucherie | 25 |
| Restaurant | 263 |
| Garage | 35 |
| Station-service | 6 |
| Banque | 53 |
| La poste | 700 |
| Coiffeur | 91 |
| Tabac | 7 |
| Bars / discothèque | 51 |
| Bibliothèque | 2 |
| Cinéma | 4 |
| Vétérinaire | 16 |
Santé |
|
|---|---|
| Pharmacie | 25 |
| Hôpital | 3 |
| Laboratoire d'analyses médicales | 8 |
| Etablissement pour handicapé | 10 |
| EHPA | 6 |
| Médecin | 38 |
| Dentiste | 35 |
| Chirurgien | 16 |
| Dermatologue | 4 |
| Anesthésiste | 7 |
| Gastro-entérologue | 4 |
| Gynécologue | 17 |
|
Cancérologue Saint-Cloud 9km |
|
| Neurologue | 3 |
| Ophtalmologue | 11 |
| ORL | 4 |
| Cardiologue | 10 |
| Pédiatre | 7 |
| Pneumologue | 1 |
| Psychologue | 11 |
| Radiologue | 24 |
| Rhumatologue | 1 |
| Sage-femme | 9 |
Éducation |
|
|---|---|
| Crêche | 54 |
| Ecole maternelle Public | 15 |
|
Ecole maternelle Privé Vélizy-Villacoublay 6km |
|
| Ecole primaire Public | 18 |
| Ecole primaire Privé | 12 |
| Collège Public | 5 |
| Collège Privé | 6 |
| Lycée Public | 5 |
| Lycée Privé | 6 |
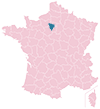
Carte de la ville de Versailles

Achat / Vente / Location Votre agence immobilière à Versailles

Les actes d'incivilités envahissent nos rues, agissons ! Un follow instagram = Un soutien
NOUVEAU : Décharges sauvages, détritus, objets abandonnés, graffitis, nids-de-poule : Déclarer un incident à Versailles


| Ville | Habitants | Superficie | Pop densité | Pop active | Taux chômage | Revenu moyen | Prix immobilier | Note globale |
|---|---|---|---|---|---|---|---|---|
| Statistiques Viroflay | 16 943 | 3 km² | 5 648 h/km² | 50% | 3.1% | 36 100 €/an | 5 966 €/m² | 4.0 |
| Statistiques Le Chesnay-Rocquencourt | 31 064 | 7 km² | 4 438 h/km² | 45.2% | 3.8% | 33 520 €/an | 5 648 €/m² | 3.4 |
| Statistiques Vélizy-Villacoublay | 22 481 | 8 km² | 2 810 h/km² | 55.4% | 3.8% | 28 610 €/an | 4 548 €/m² | 4.2 |
| Statistiques Buc | 5 868 | 8 km² | 734 h/km² | 50% | 2.9% | 35 400 €/an | 4 874 €/m² | 4.5 |
| Statistiques Les Loges-en-Josas | 1 655 | 2 km² | 828 h/km² | 44.7% | 3.4% | 40 940 €/an | 5 401 €/m² | 3.0 |
| Statistiques Jouy-en-Josas | 7 985 | 10 km² | 799 h/km² | 40.7% | 3.7% | 35 740 €/an | 4 751 €/m² | 3.1 |
| Statistiques Vaucresson | 8 506 | 3 km² | 2 835 h/km² | 47.9% | 3.6% | 41 320 €/an | 5 013 €/m² | 3.8 |
| Statistiques Marnes-la-Coquette | 1 758 | 3 km² | 586 h/km² | 46.6% | 4.4% | 41 740 €/an | 6 263 €/m² | 3.3 |
| Statistiques Saint-Cyr-l'École | 20 451 | 5 km² | 4 090 h/km² | 54.8% | 4.8% | 26 750 €/an | 4 004 €/m² | 2.8 |
| Statistiques Chaville | 20 198 | 3 km² | 6 733 h/km² | 54.5% | 4.5% | 32 290 €/an | 5 906 €/m² | 3.6 |
| Statistiques Ville-d'Avray | 10 871 | 3 km² | 3 624 h/km² | 48.1% | 3.9% | 38 490 €/an | 5 659 €/m² | 3.8 |
| Statistiques Sèvres | 22 782 | 3 km² | 7 594 h/km² | 51% | 4.8% | 33 680 €/an | 6 251 €/m² | 3.8 |
| Statistiques La Celle-Saint-Cloud | 20 440 | 5 km² | 4 088 h/km² | 47.1% | 4.5% | 29 510 €/an | 4 381 €/m² | 2.2 |
| Statistiques Toussus-le-Noble | 1 176 | 4 km² | 294 h/km² | 51.2% | 3.4% | 35 870 €/an | 3 642 €/m² | 3.5 |
| Statistiques Garches | 17 705 | 2 km² | 8 853 h/km² | 49.1% | 4.7% | 36 150 €/an | 6 029 €/m² | 3.8 |