


Signalement de photo
Merci ! Votre signalement est envoyé !
Quel est le nombre d'habitants à Volonne ? Dans quel département et dans quelle région se situe la ville ? Quelle est sa superficie ?
Quels sont les chiffres de la délinquance ?
Découvrez sur cette page toutes les informations essentielles sur la population, la sécurité, les services et l'immobilier à Volonne.
NOUVEAU : Rues sales, dépôts sauvages, dégradations urbaines. Faites votre signalement anonyme, nous nous chargeons de prévenir les autorités compétentes.
| Nombre d'habitants | 1 638 | Classement |
| Age moyen | 47 ans | Classement |
| Pop active | 46% | Classement |
| Taux chômage | 5.4% | Classement |
| Pop densité | 66 h/km² | Classement |
| Revenu moyen | 22 980 €/an | Classement |
| Agressions physiques / sexuelles | 5 |
| Cambriolages | 0 |
| Vols / dégradations | 20 |
| Stupéfiants | 0 |
Achat / Vente / Location Votre agence immobilière à Volonne
| Prix moyen | 207 801 € | Prix moyen au m² | 2 017 € |
| Prix moyen | 112 104 € | Prix moyen au m² | 1 784 € |
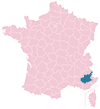
Carte de la ville de Volonne

Commerce |
|
|---|---|
|
Hypermarché (11km) Sisteron |
|
|
Supermarché (3km) Château-Arnoux-Saint-Auban |
|
| Boulangerie | 3 |
| Boucherie | 1 |
|
Station-service (3km) Château-Arnoux-Saint-Auban |
|
|
Banque (3km) Château-Arnoux-Saint-Auban |
|
| La poste | 1 |
| Coiffeur | 3 |
|
Vétérinaire (3km) Château-Arnoux-Saint-Auban |
|
| Restaurant | 5 |
Santé |
|
|---|---|
| Médecin | 5 |
| Dentiste | 1 |
| Pharmacie | 1 |
Éducation |
|
|---|---|
| Maternelle | 2 |
| Primaire | 1 |
|
Collège (3km) Château-Arnoux-Saint-Auban |
|
|
Lycée (11km) Sisteron |
|


NOUVEAU : Décharges sauvages, détritus, objets abandonnés, graffitis, nids-de-poule : Déclarer un incident à Volonne


 Marine LE PEN
 Emmanuel MACRON
 Jean-Luc MÉLENCHON
 Éric ZEMMOUR
 Valérie PÉCRESSE
 Jean LASSALLE
 Yannick JADOT
 Fabien ROUSSEL
 Anne HIDALGO
 Nicolas DUPONT-AIGNAN
 Philippe POUTOU
 Nathalie ARTHAUDEmmanuel MACRONMarine LE PEN
| Ville | Habitants | Superficie | Pop densité | Pop active | Taux chômage | Revenu moyen | Prix immobilier | Note globale |
|---|---|---|---|---|---|---|---|---|
| Statistiques Château-Arnoux-Saint-Auban | 5 082 | 18 km² | 282 h/km² | 41% | 7.4% | 21 080 €/an | 1 744 €/m² | 2.3 |
| Statistiques Sourribes | 179 | 20 km² | 9 h/km² | 52% | 6.1% | 19 960 €/an | 1 687 €/m² | - |
| Statistiques L'Escale | 1 377 | 20 km² | 69 h/km² | 43.7% | 4.5% | 23 510 €/an | 2 104 €/m² | 3.6 |
| Statistiques Aubignosc | 614 | 15 km² | 41 h/km² | 50.7% | 6% | 22 860 €/an | 1 593 €/m² | - |
| Statistiques Peipin | 1 480 | 13 km² | 114 h/km² | 41.8% | 5.3% | 21 980 €/an | 1 936 €/m² | - |
| Statistiques Châteauneuf-Val-Saint-Donat | 516 | 21 km² | 25 h/km² | 44% | 4.5% | 23 770 €/an | 2 129 €/m² | 4.0 |
| Statistiques Salignac | 679 | 14 km² | 49 h/km² | 50.8% | 4.9% | 23 880 €/an | 2 618 €/m² | - |
| Statistiques Montfort | 329 | 12 km² | 27 h/km² | 43.2% | 4.6% | 21 530 €/an | 2 406 €/m² | - |
| Statistiques Malijai | 2 002 | 27 km² | 74 h/km² | 44% | 5.1% | 21 250 €/an | 1 696 €/m² | 3.0 |
| Statistiques Mirabeau | 509 | 18 km² | 28 h/km² | 49.9% | 5.7% | 24 700 €/an | 1 950 €/m² | - |
| Statistiques Barras | 146 | 21 km² | 7 h/km² | 46.6% | 3.4% | 21 420 €/an | 2 336 €/m² | - |
| Statistiques Entrepierres | 396 | 48 km² | 8 h/km² | 43.7% | 3% | 25 900 €/an | 2 780 €/m² | - |
| Statistiques Les Mées | 3 884 | 65 km² | 60 h/km² | 42.9% | 7.4% | 21 460 €/an | 2 048 €/m² | 2.6 |
| Statistiques Aiglun | 1 413 | 15 km² | 94 h/km² | 42% | 3.5% | 24 270 €/an | 2 149 €/m² | 4.6 |
| Statistiques Mallefougasse-Augès | 324 | 20 km² | 16 h/km² | 38.9% | 4% | 23 980 €/an | 2 591 €/m² | - |