


Signalement de photo
Merci ! Votre signalement est envoyé !
Quel est le nombre d'habitants à Villedoux ? Dans quel département et dans quelle région se situe la ville ? Quelle est sa superficie ?
Quels sont les chiffres de la délinquance ?
Découvrez sur cette page toutes les informations essentielles sur la population, la sécurité, les services et l'immobilier à Villedoux.
NOUVEAU : Rues sales, dépôts sauvages, dégradations urbaines. Faites votre signalement anonyme, nous nous chargeons de prévenir les autorités compétentes.
| Nombre d'habitants | 2 316 | Classement |
| Age moyen | 35 ans | Classement |
| Pop active | 51.9% | Classement |
| Taux chômage | 4% | Classement |
| Pop densité | 145 h/km² | Classement |
| Revenu moyen | 24 290 €/an | Classement |
| Agressions physiques / sexuelles | 0 |
| Cambriolages | 0 |
| Vols / dégradations | 8 |
| Stupéfiants | 0 |
Achat / Vente / Location Votre agence immobilière à Villedoux
| Prix moyen | 287 484 € | Prix moyen au m² | 2 769 € |
| Prix moyen | 59 333 € | Prix moyen au m² | 937 € |
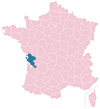
Carte de la ville de Villedoux

Commerce |
|
|---|---|
|
Hypermarché (7km) Puilboreau |
|
|
Supermarché (5km) Saint-Xandre |
|
| Boulangerie | 1 |
|
Boucherie (5km) Saint-Xandre |
|
|
Station-service (5km) Saint-Xandre |
|
|
Banque (5km) Saint-Xandre |
|
|
La poste (2km) Andilly |
|
| Coiffeur | 4 |
|
Vétérinaire (3km) Esnandes |
|
| Restaurant | 3 |
Éducation |
|
|---|---|
| Maternelle | 1 |
| Primaire | 1 |
|
Collège (6km) Dompierre-sur-Mer |
|
|
Lycée (11km) La Rochelle |
|


NOUVEAU : Décharges sauvages, détritus, objets abandonnés, graffitis, nids-de-poule : Déclarer un incident à Villedoux


 Emmanuel MACRON
 Marine LE PEN
 Jean-Luc MÉLENCHON
 Yannick JADOT
 Éric ZEMMOUR
 Jean LASSALLE
 Valérie PÉCRESSE
 Fabien ROUSSEL
 Anne HIDALGO
 Nicolas DUPONT-AIGNAN
 Philippe POUTOU
 Nathalie ARTHAUDEmmanuel MACRONMarine LE PEN
| Ville | Habitants | Superficie | Pop densité | Pop active | Taux chômage | Revenu moyen | Prix immobilier | Note globale |
|---|---|---|---|---|---|---|---|---|
| Statistiques Saint-Ouen-d'Aunis | 2 083 | 9 km² | 231 h/km² | 51.6% | 3.2% | 24 450 €/an | 2 110 €/m² | 2.8 |
| Statistiques Andilly | 2 312 | 29 km² | 80 h/km² | 48.3% | 3.8% | 24 260 €/an | 2 006 €/m² | - |
| Statistiques Esnandes | 2 103 | 7 km² | 300 h/km² | 44.5% | 5.3% | 23 500 €/an | 2 125 €/m² | - |
| Statistiques Longèves | 1 058 | 13 km² | 81 h/km² | 56% | 3.2% | 24 300 €/an | 2 280 €/m² | - |
| Statistiques Marsilly | 3 194 | 12 km² | 266 h/km² | 45.2% | 3.8% | 27 760 €/an | 2 756 €/m² | 4.0 |
| Statistiques Saint-Xandre | 5 384 | 13 km² | 414 h/km² | 44% | 4.1% | 25 370 €/an | 2 702 €/m² | 3.9 |
| Statistiques Dompierre-sur-Mer | 5 961 | 18 km² | 331 h/km² | 43.7% | 3.7% | 26 110 €/an | 2 679 €/m² | 3.5 |
| Statistiques Sainte-Soulle | 4 961 | 22 km² | 226 h/km² | 50% | 3.3% | 25 310 €/an | 2 175 €/m² | 3.7 |
| Statistiques Charron | 2 002 | 38 km² | 53 h/km² | 46.2% | 3.7% | 23 250 €/an | 1 844 €/m² | 3.8 |
| Statistiques Puilboreau | 6 635 | 8 km² | 829 h/km² | 43.5% | 4.6% | 24 990 €/an | 2 831 €/m² | 4.5 |
| Statistiques Vérines | 2 339 | 13 km² | 180 h/km² | 52.2% | 3.8% | 24 310 €/an | 2 115 €/m² | - |
| Statistiques Bourgneuf | 1 418 | 3 km² | 473 h/km² | 45.3% | 2.8% | 26 290 €/an | 1 972 €/m² | 3.7 |
| Statistiques Angliers | 1 285 | 11 km² | 117 h/km² | 53.2% | 5.2% | 24 040 €/an | 2 155 €/m² | - |
| Statistiques Marans | 4 500 | 82 km² | 55 h/km² | 41.8% | 4% | 21 500 €/an | 1 542 €/m² | 3.4 |
| Statistiques Lagord | 7 387 | 8 km² | 923 h/km² | 38.7% | 4% | 27 680 €/an | 2 978 €/m² | 4.5 |