


Signalement de photo
Merci ! Votre signalement est envoyé !
Quel est le nombre d'habitants à Villaz ? Dans quel département et dans quelle région se situe la ville ? Quelle est sa superficie ?
Quels sont les chiffres de la délinquance ?
Découvrez sur cette page toutes les informations essentielles sur la population, la sécurité, les services et l'immobilier à Villaz.
NOUVEAU : Rues sales, dépôts sauvages, dégradations urbaines. Faites votre signalement anonyme, nous nous chargeons de prévenir les autorités compétentes.
| Nombre d'habitants | 3 468 | Classement |
| Age moyen | 39 ans | Classement |
| Pop active | 51% | Classement |
| Taux chômage | 2.1% | Classement |
| Pop densité | 231 h/km² | Classement |
| Revenu moyen | 32 720 €/an | Classement |
| Agressions physiques / sexuelles | 0 |
| Cambriolages | 0 |
| Vols / dégradations | 18 |
| Stupéfiants | 0 |
Achat / Vente / Location Votre agence immobilière à Villaz
| Prix moyen | 605 098 € | Prix moyen au m² | 4 921 € |
| Prix moyen | 241 967 € | Prix moyen au m² | 4 816 € |
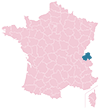
Carte de la ville de Villaz

Commerce |
|
|---|---|
|
Hypermarché (7km) Epagny Metz-Tessy |
|
| Supermarché | 1 |
| Boulangerie | 2 |
| Boucherie | 2 |
|
Station-service (3km) Argonay |
|
| Banque | 1 |
| La poste | 1 |
| Coiffeur | 3 |
|
Vétérinaire (3km) Argonay |
|
| Restaurant | 4 |
Santé |
|
|---|---|
| Médecin | 16 |
| Dentiste | 2 |
| Pharmacie | 2 |


NOUVEAU : Décharges sauvages, détritus, objets abandonnés, graffitis, nids-de-poule : Déclarer un incident à Villaz


 Emmanuel MACRON
 Marine LE PEN
 Jean-Luc MÉLENCHON
 Yannick JADOT
 Éric ZEMMOUR
 Valérie PÉCRESSE
 Jean LASSALLE
 Nicolas DUPONT-AIGNAN
 Anne HIDALGO
 Fabien ROUSSEL
 Philippe POUTOU
 Nathalie ARTHAUDEmmanuel MACRONMarine LE PEN
| Ville | Habitants | Superficie | Pop densité | Pop active | Taux chômage | Revenu moyen | Prix immobilier | Note globale |
|---|---|---|---|---|---|---|---|---|
| Statistiques Nâves-Parmelan | 1 002 | 5 km² | 200 h/km² | 49.3% | 2.5% | 33 320 €/an | 3 067 €/m² | - |
| Statistiques Charvonnex | 1 524 | 5 km² | 305 h/km² | 52.1% | 2.9% | 32 390 €/an | 3 946 €/m² | 2.0 |
| Statistiques Argonay | 3 600 | 5 km² | 720 h/km² | 50.5% | 3.4% | 30 740 €/an | 5 423 €/m² | 2.8 |
| Statistiques Cuvat | 1 611 | 5 km² | 322 h/km² | 54.6% | 3.2% | 42 430 €/an | 5 152 €/m² | - |
| Statistiques Dingy-Saint-Clair | 1 452 | 34 km² | 43 h/km² | 55% | 2% | 31 240 €/an | 3 852 €/m² | - |
| Statistiques Villy-le-Pelloux | 996 | 3 km² | 332 h/km² | 57.5% | 3.4% | 35 960 €/an | 3 735 €/m² | - |
| Statistiques Fillière | 9 547 | 119 km² | 80 h/km² | 51.8% | 3.5% | 32 280 €/an | 3 750 €/m² | 2.6 |
| Statistiques Epagny Metz-Tessy | 8 454 | 12 km² | 705 h/km² | 55% | 4% | 30 270 €/an | 4 614 €/m² | 4.5 |
| Statistiques Groisy | 3 990 | 21 km² | 190 h/km² | 54% | 2.9% | 33 100 €/an | 3 692 €/m² | 2.8 |
| Statistiques Veyrier-du-Lac | 2 297 | 8 km² | 287 h/km² | 40.6% | 3.8% | 44 530 €/an | 5 972 €/m² | 4.5 |
| Statistiques Allonzier-la-Caille | 2 176 | 10 km² | 218 h/km² | 58.7% | 5% | 32 440 €/an | 3 660 €/m² | - |
| Statistiques Annecy | 131 715 | 67 km² | 1 966 h/km² | 49.8% | 4.8% | 26 250 €/an | 4 270 €/m² | 3.4 |
| Statistiques Alex | 1 113 | 17 km² | 65 h/km² | 50.9% | 3.6% | 30 290 €/an | 4 962 €/m² | - |
| Statistiques Villy-le-Bouveret | 623 | 3 km² | 208 h/km² | 53% | 3.7% | 37 060 €/an | 4 575 €/m² | - |
| Statistiques La Balme-de-Thuy | 452 | 18 km² | 25 h/km² | 55.5% | 2.9% | 26 330 €/an | 3 945 €/m² | - |