


Signalement de photo
Merci ! Votre signalement est envoyé !
Quel est le nombre d'habitants à Soubise ? Dans quel département et dans quelle région se situe la ville ? Quelle est sa superficie ?
Quels sont les chiffres de la délinquance ?
Découvrez sur cette page toutes les informations essentielles sur la population, la sécurité, les services et l'immobilier à Soubise.
NOUVEAU : Rues sales, dépôts sauvages, dégradations urbaines. Faites votre signalement anonyme, nous nous chargeons de prévenir les autorités compétentes.
| Nombre d'habitants | 3 641 | Classement |
| Age moyen | 38 ans | Classement |
| Pop active | 55.4% | Classement |
| Taux chômage | 2.3% | Classement |
| Pop densité | 331 h/km² | Classement |
| Revenu moyen | 23 660 €/an | Classement |
| Agressions physiques / sexuelles | 17 |
| Cambriolages | 8 |
| Vols / dégradations | 23 |
| Stupéfiants | 0 |
Achat / Vente / Location Votre agence immobilière à Soubise
| Prix moyen | 238 031 € | Prix moyen au m² | 2 292 € |
| Prix moyen | 87 589 € | Prix moyen au m² | 1 743 € |
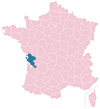
Carte de la ville de Soubise

Commerce |
|
|---|---|
|
Hypermarché (1km) Rochefort |
|
| Supermarché | 1 |
| Boulangerie | 1 |
|
Boucherie (1km) Rochefort |
|
| Station-service | 1 |
|
Banque (1km) Rochefort |
|
| La poste | 1 |
| Coiffeur | 2 |
|
Vétérinaire (1km) Rochefort |
|
| Restaurant | 3 |
Santé |
|
|---|---|
| Médecin | 4 |
| Dentiste | 2 |
| Pharmacie | 1 |


NOUVEAU : Décharges sauvages, détritus, objets abandonnés, graffitis, nids-de-poule : Déclarer un incident à Soubise


 Emmanuel MACRON
 Marine LE PEN
 Jean-Luc MÉLENCHON
 Éric ZEMMOUR
 Yannick JADOT
 Valérie PÉCRESSE
 Fabien ROUSSEL
 Jean LASSALLE
 Nicolas DUPONT-AIGNAN
 Nathalie ARTHAUD
 Anne HIDALGO
 Philippe POUTOUEmmanuel MACRONMarine LE PEN
| Ville | Habitants | Superficie | Pop densité | Pop active | Taux chômage | Revenu moyen | Prix immobilier | Note globale |
|---|---|---|---|---|---|---|---|---|
| Statistiques Rochefort | 23 092 | 22 km² | 1 050 h/km² | 43.7% | 8.9% | 20 380 €/an | 1 878 €/m² | 3.4 |
| Statistiques Vergeroux | 1 292 | 6 km² | 215 h/km² | 45.4% | 4.3% | 25 660 €/an | 2 003 €/m² | - |
| Statistiques Saint-Froult | 382 | 6 km² | 64 h/km² | 38.5% | 6.8% | 21 530 €/an | 2 018 €/m² | - |
| Statistiques Saint-Nazaire-sur-Charente | 1 210 | 20 km² | 61 h/km² | 43.9% | 4.1% | 22 300 €/an | 1 618 €/m² | - |
| Statistiques Moëze | 597 | 21 km² | 28 h/km² | 44.6% | 6.4% | 21 620 €/an | 1 574 €/m² | - |
| Statistiques Échillais | 3 567 | 15 km² | 238 h/km² | 43.4% | 4.7% | 23 030 €/an | 1 762 €/m² | 2.8 |
| Statistiques Saint-Laurent-de-la-Prée | 2 271 | 28 km² | 81 h/km² | 45.4% | 3.2% | 25 210 €/an | 2 178 €/m² | 4.2 |
| Statistiques Breuil-Magné | 1 863 | 22 km² | 85 h/km² | 45.4% | 2.6% | 25 710 €/an | 2 171 €/m² | - |
| Statistiques Beaugeay | 785 | 15 km² | 52 h/km² | 47.4% | 5.5% | 23 560 €/an | 1 641 €/m² | - |
| Statistiques Saint-Agnant | 2 772 | 22 km² | 126 h/km² | 44.6% | 4.9% | 23 590 €/an | 1 434 €/m² | 3.8 |
| Statistiques Tonnay-Charente | 8 195 | 34 km² | 241 h/km² | 44.3% | 4.7% | 21 650 €/an | 1 640 €/m² | 3.1 |
| Statistiques Loire-les-Marais | 386 | 12 km² | 32 h/km² | 50% | 3.9% | 23 250 €/an | 1 493 €/m² | 4.4 |
| Statistiques Saint-Hippolyte | 1 477 | 23 km² | 64 h/km² | 49.8% | 4.2% | 22 390 €/an | 1 765 €/m² | 4.0 |
| Statistiques Fouras | 4 061 | 10 km² | 406 h/km² | 32% | 3.6% | 25 880 €/an | 3 362 €/m² | 3.6 |
| Statistiques Trizay | 1 473 | 14 km² | 105 h/km² | 45.3% | 4.3% | 23 840 €/an | 1 274 €/m² | 2.8 |