


Signalement de photo
Merci ! Votre signalement est envoyé !
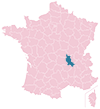
Quel est le nombre d'habitants à Sorbiers ? Dans quel département et dans quelle région se situe la ville ? Quelle est sa superficie ?
Quels sont les chiffres de la délinquance ?
Découvrez sur cette page toutes les informations essentielles sur la population, la sécurité, les services et l'immobilier à Sorbiers.
NOUVEAU : Rues sales, dépôts sauvages, dégradations urbaines. Faites votre signalement anonyme, nous nous chargeons de prévenir les autorités compétentes.
| Nombre d'habitants | 8 042 | Classement |
| Age moyen | 43 ans | Classement |
| Pop active | 45.4% | Classement |
| Taux chômage | 3.4% | Classement |
| Pop densité | 670 h/km² | Classement |
| Revenu moyen | 25 720 €/an | Classement |
| Agressions physiques / sexuelles | 42 |
| Cambriolages | 42 |
| Vols / dégradations | 101 |
| Stupéfiants | 28 |
Achat / Vente / Location Votre agence immobilière à Sorbiers
| Prix moyen | 248 726 € | Prix moyen au m² | 2 450 € |
| Prix moyen | 123 988 € | Prix moyen au m² | 1 817 € |
Carte de la ville de Sorbiers

Commerce |
|
|---|---|
|
Hypermarché (4km) Saint-Chamond |
|
| Supermarché | 2 |
| Boulangerie | 5 |
| Boucherie | 3 |
| Station-service | 2 |
|
Banque (1km) La Talaudière |
|
| La poste | 1 |
| Coiffeur | 5 |
|
Vétérinaire (1km) La Talaudière |
|
| Restaurant | 13 |
Santé |
|
|---|---|
| Médecin | 11 |
| Dentiste | 3 |
| Pharmacie | 2 |
Éducation |
|
|---|---|
| Maternelle | 6 |
| Primaire | 6 |
|
Collège (1km) La Talaudière |
|
|
Lycée (4km) Saint-Chamond |
|


NOUVEAU : Décharges sauvages, détritus, objets abandonnés, graffitis, nids-de-poule : Déclarer un incident à Sorbiers


 Emmanuel MACRON
 Marine LE PEN
 Jean-Luc MÉLENCHON
 Éric ZEMMOUR
 Yannick JADOT
 Valérie PÉCRESSE
 Jean LASSALLE
 Fabien ROUSSEL
 Nicolas DUPONT-AIGNAN
 Anne HIDALGO
 Philippe POUTOU
 Nathalie ARTHAUDEmmanuel MACRONMarine LE PEN
| Ville | Habitants | Superficie | Pop densité | Pop active | Taux chômage | Revenu moyen | Prix immobilier | Note globale |
|---|---|---|---|---|---|---|---|---|
| Statistiques La Talaudière | 7 073 | 8 km² | 884 h/km² | 39.1% | 4.4% | 23 700 €/an | 2 269 €/m² | 3.3 |
| Statistiques Saint-Jean-Bonnefonds | 6 611 | 12 km² | 551 h/km² | 45% | 4.1% | 23 950 €/an | 2 071 €/m² | 3.2 |
| Statistiques La Tour-en-Jarez | 1 473 | 5 km² | 295 h/km² | 44.1% | 4% | 30 650 €/an | 2 052 €/m² | 3.5 |
| Statistiques Saint-Chamond | 35 068 | 55 km² | 638 h/km² | 41.2% | 6.1% | 20 330 €/an | 1 545 €/m² | 3.2 |
| Statistiques L'Étrat | 2 778 | 8 km² | 347 h/km² | 44.5% | 3.5% | 27 460 €/an | 2 505 €/m² | 2.5 |
| Statistiques Valfleury | 709 | 9 km² | 79 h/km² | 53.7% | 2.3% | 23 260 €/an | 1 591 €/m² | - |
| Statistiques Saint-Priest-en-Jarez | 6 164 | 3 km² | 2 055 h/km² | 44.5% | 4.3% | 25 120 €/an | 2 100 €/m² | 3.2 |
| Statistiques Saint-Étienne | 172 718 | 80 km² | 2 159 h/km² | 42.2% | 8.5% | 19 010 €/an | 1 135 €/m² | 3.2 |
| Statistiques Saint-Héand | 3 686 | 31 km² | 119 h/km² | 44.7% | 2.4% | 25 650 €/an | 2 073 €/m² | 4.1 |
| Statistiques Cellieu | 1 706 | 12 km² | 142 h/km² | 49.7% | 3.2% | 26 190 €/an | 2 118 €/m² | - |
| Statistiques Fontanès | 680 | 7 km² | 97 h/km² | 49.7% | 2.6% | 23 590 €/an | 1 602 €/m² | - |
| Statistiques L'Horme | 4 845 | 4 km² | 1 211 h/km² | 43% | 6.5% | 21 200 €/an | 1 993 €/m² | 3.6 |
| Statistiques Saint-Christo-en-Jarez | 1 896 | 22 km² | 86 h/km² | 51.1% | 1.8% | 24 420 €/an | 2 102 €/m² | 4.6 |
| Statistiques La Gimond | 278 | 3 km² | 93 h/km² | 45.3% | 1.1% | 22 910 €/an | 1 874 €/m² | - |
| Statistiques Villars | 7 783 | 6 km² | 1 297 h/km² | 44.9% | 3.7% | 23 540 €/an | 1 372 €/m² | 3.4 |