


Signalement de photo
Merci ! Votre signalement est envoyé !
Quel est le nombre d'habitants à Sautron ? Dans quel département et dans quelle région se situe la ville ? Quelle est sa superficie ?
Quels sont les chiffres de la délinquance ?
Découvrez sur cette page toutes les informations essentielles sur la population, la sécurité, les services et l'immobilier à Sautron.
NOUVEAU : Rues sales, dépôts sauvages, dégradations urbaines. Faites votre signalement anonyme, nous nous chargeons de prévenir les autorités compétentes.
| Nombre d'habitants | 8 512 | Classement |
| Age moyen | 44 ans | Classement |
| Pop active | 44.6% | Classement |
| Taux chômage | 3.7% | Classement |
| Pop densité | 501 h/km² | Classement |
| Revenu moyen | 29 660 €/an | Classement |
| Agressions physiques / sexuelles | 55 |
| Cambriolages | 38 |
| Vols / dégradations | 148 |
| Stupéfiants | 0 |
Achat / Vente / Location Votre agence immobilière à Sautron
| Prix moyen | 368 796 € | Prix moyen au m² | 2 762 € |
| Prix moyen | 230 585 € | Prix moyen au m² | 3 816 € |
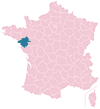
Carte de la ville de Sautron

Commerce |
|
|---|---|
| Hypermarché | 1 |
| Supermarché | 2 |
| Boulangerie | 3 |
| Boucherie | 3 |
| Station-service | 1 |
| Banque | 7 |
| La poste | 1 |
| Coiffeur | 12 |
| Vétérinaire | 2 |
| Restaurant | 18 |
Santé |
|
|---|---|
| Médecin | 15 |
| Dentiste | 6 |
| Pharmacie | 2 |


NOUVEAU : Décharges sauvages, détritus, objets abandonnés, graffitis, nids-de-poule : Déclarer un incident à Sautron


 Emmanuel MACRON
 Marine LE PEN
 Jean-Luc MÉLENCHON
 Valérie PÉCRESSE
 Éric ZEMMOUR
 Yannick JADOT
 Anne HIDALGO
 Jean LASSALLE
 Nicolas DUPONT-AIGNAN
 Fabien ROUSSEL
 Philippe POUTOU
 Nathalie ARTHAUDEmmanuel MACRONMarine LE PEN
| Ville | Habitants | Superficie | Pop densité | Pop active | Taux chômage | Revenu moyen | Prix immobilier | Note globale |
|---|---|---|---|---|---|---|---|---|
| Statistiques Orvault | 27 872 | 28 km² | 995 h/km² | 45.4% | 4.4% | 27 140 €/an | 2 941 €/m² | 3.5 |
| Statistiques Saint-Herblain | 49 537 | 30 km² | 1 651 h/km² | 47.4% | 5.9% | 23 000 €/an | 2 510 €/m² | 3.1 |
| Statistiques Vigneux-de-Bretagne | 6 480 | 55 km² | 118 h/km² | 50.4% | 2.3% | 28 250 €/an | 2 256 €/m² | 4.2 |
| Statistiques Couëron | 23 057 | 44 km² | 524 h/km² | 49.9% | 4.2% | 24 290 €/an | 2 654 €/m² | 3.1 |
| Statistiques Treillières | 10 230 | 29 km² | 353 h/km² | 50.7% | 3.8% | 27 760 €/an | 2 626 €/m² | 3.9 |
| Statistiques Saint-Jean-de-Boiseau | 5 982 | 11 km² | 544 h/km² | 50% | 4.8% | 24 230 €/an | 2 541 €/m² | 3.0 |
| Statistiques Saint-Étienne-de-Montluc | 7 658 | 58 km² | 132 h/km² | 48.2% | 2.9% | 26 740 €/an | 2 635 €/m² | 4.2 |
| Statistiques La Montagne | 6 488 | 4 km² | 1 622 h/km² | 47.7% | 4.4% | 24 140 €/an | 2 682 €/m² | 3.8 |
| Statistiques La Chapelle-sur-Erdre | 20 331 | 33 km² | 616 h/km² | 47.1% | 4% | 28 210 €/an | 3 118 €/m² | 3.4 |
| Statistiques Le Pellerin | 5 358 | 31 km² | 173 h/km² | 48.1% | 4.1% | 23 370 €/an | 2 312 €/m² | - |
| Statistiques Bouguenais | 20 410 | 32 km² | 638 h/km² | 48.3% | 4.8% | 23 740 €/an | 2 708 €/m² | 3.0 |
| Statistiques Le Temple-de-Bretagne | 2 036 | 2 km² | 1 018 h/km² | 50.4% | 2.9% | 24 610 €/an | 2 070 €/m² | 3.4 |
| Statistiques Nantes | 323 204 | 65 km² | 4 972 h/km² | 50.3% | 7.3% | 24 170 €/an | 3 459 €/m² | 3.2 |
| Statistiques Rezé | 42 998 | 14 km² | 3 071 h/km² | 49.3% | 5.4% | 23 550 €/an | 2 783 €/m² | 3.4 |
| Statistiques Brains | 2 811 | 15 km² | 187 h/km² | 52.7% | 3.5% | 26 040 €/an | 2 255 €/m² | - |