


Signalement de photo
Merci ! Votre signalement est envoyé !
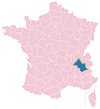
Quel est le nombre d'habitants à Saint-Savin ? Dans quel département et dans quelle région se situe la ville ? Quelle est sa superficie ?
Quels sont les chiffres de la délinquance ?
Découvrez sur cette page toutes les informations essentielles sur la population, la sécurité, les services et l'immobilier à Saint-Savin.
NOUVEAU : Rues sales, dépôts sauvages, dégradations urbaines. Faites votre signalement anonyme, nous nous chargeons de prévenir les autorités compétentes.
| Nombre d'habitants | 4 264 | Classement |
| Age moyen | 41 ans | Classement |
| Pop active | 50.7% | Classement |
| Taux chômage | 2.8% | Classement |
| Pop densité | 171 h/km² | Classement |
| Revenu moyen | 26 140 €/an | Classement |
| Agressions physiques / sexuelles | 6 |
| Cambriolages | 21 |
| Vols / dégradations | 32 |
| Stupéfiants | 0 |
Achat / Vente / Location Votre agence immobilière à Saint-Savin
| Prix moyen | 227 795 € | Prix moyen au m² | 2 178 € |
| Prix moyen | 70 000 € | Prix moyen au m² | 1 795 € |
Carte de la ville de Saint-Savin

Commerce |
|
|---|---|
|
Hypermarché (5km) Bourgoin-Jallieu |
|
|
Supermarché (5km) Bourgoin-Jallieu |
|
| Boulangerie | 2 |
| Boucherie | 1 |
|
Station-service (5km) Bourgoin-Jallieu |
|
|
Banque (5km) Bourgoin-Jallieu |
|
| La poste | 1 |
| Coiffeur | 3 |
|
Vétérinaire (5km) Bourgoin-Jallieu |
|
| Restaurant | 9 |
Santé |
|
|---|---|
| Médecin | 5 |
| Dentiste | 2 |
| Pharmacie | 1 |
Éducation |
|
|---|---|
| Maternelle | 3 |
| Primaire | 2 |
|
Collège (5km) Bourgoin-Jallieu |
|
|
Lycée (5km) Bourgoin-Jallieu |
|


NOUVEAU : Décharges sauvages, détritus, objets abandonnés, graffitis, nids-de-poule : Déclarer un incident à Saint-Savin


 Marine LE PEN
 Emmanuel MACRON
 Jean-Luc MÉLENCHON
 Éric ZEMMOUR
 Valérie PÉCRESSE
 Yannick JADOT
 Jean LASSALLE
 Nicolas DUPONT-AIGNAN
 Fabien ROUSSEL
 Anne HIDALGO
 Philippe POUTOU
 Nathalie ARTHAUDEmmanuel MACRONMarine LE PEN
| Ville | Habitants | Superficie | Pop densité | Pop active | Taux chômage | Revenu moyen | Prix immobilier | Note globale |
|---|---|---|---|---|---|---|---|---|
| Statistiques Saint-Hilaire-de-Brens | 599 | 8 km² | 75 h/km² | 52.3% | 4.2% | 27 330 €/an | 3 061 €/m² | - |
| Statistiques Vénérieu | 983 | 6 km² | 164 h/km² | 49.7% | 3% | 28 370 €/an | 4 040 €/m² | - |
| Statistiques Bourgoin-Jallieu | 29 577 | 24 km² | 1 232 h/km² | 46.9% | 7.5% | 20 870 €/an | 2 129 €/m² | 3.0 |
| Statistiques Ruy-Montceau | 4 752 | 21 km² | 226 h/km² | 47.3% | 2.9% | 27 990 €/an | 2 607 €/m² | 3.7 |
| Statistiques Saint-Chef | 3 795 | 27 km² | 141 h/km² | 49% | 4% | 26 030 €/an | 2 709 €/m² | 3.3 |
| Statistiques Salagnon | 1 459 | 8 km² | 182 h/km² | 52.6% | 4.7% | 26 000 €/an | 1 659 €/m² | 4.4 |
| Statistiques L'Isle-d'Abeau | 17 206 | 9 km² | 1 912 h/km² | 49.6% | 6.7% | 21 370 €/an | 2 376 €/m² | 3.4 |
| Statistiques Saint-Marcel-Bel-Accueil | 1 455 | 18 km² | 81 h/km² | 48.2% | 2.6% | 29 880 €/an | 2 140 €/m² | - |
| Statistiques Trept | 2 135 | 16 km² | 133 h/km² | 52.7% | 2.8% | 25 590 €/an | 1 907 €/m² | 3.8 |
| Statistiques Saint-Alban-de-Roche | 2 113 | 6 km² | 352 h/km² | 51.1% | 3.8% | 28 440 €/an | 2 667 €/m² | 4.1 |
| Statistiques Montcarra | 591 | 5 km² | 118 h/km² | 51.6% | 2.7% | 24 670 €/an | 2 500 €/m² | 2.4 |
| Statistiques Domarin | 1 681 | 3 km² | 560 h/km² | 49.3% | 3.9% | 26 660 €/an | 2 492 €/m² | 5.0 |
| Statistiques Moras | 525 | 8 km² | 66 h/km² | 49.1% | 2.3% | 29 160 €/an | 1 717 €/m² | 2.4 |
| Statistiques Maubec | 1 909 | 9 km² | 212 h/km² | 46% | 3.8% | 28 660 €/an | 2 552 €/m² | - |
| Statistiques Meyrié | 1 067 | 3 km² | 356 h/km² | 45.1% | 2.6% | 31 300 €/an | 2 146 €/m² | 3.6 |