


Signalement de photo
Merci ! Votre signalement est envoyé !
Quel est le nombre d'habitants à Saint-Perdon ? Dans quel département et dans quelle région se situe la ville ? Quelle est sa superficie ?
Quels sont les chiffres de la délinquance ?
Découvrez sur cette page toutes les informations essentielles sur la population, la sécurité, les services et l'immobilier à Saint-Perdon.
NOUVEAU : Rues sales, dépôts sauvages, dégradations urbaines. Faites votre signalement anonyme, nous nous chargeons de prévenir les autorités compétentes.
| Nombre d'habitants | 1 725 | Classement |
| Age moyen | 38 ans | Classement |
| Pop active | 51.5% | Classement |
| Taux chômage | 4.9% | Classement |
| Pop densité | 56 h/km² | Classement |
| Revenu moyen | 23 740 €/an | Classement |
| Agressions physiques / sexuelles | 0 |
| Cambriolages | 0 |
| Vols / dégradations | 0 |
| Stupéfiants | 0 |
Achat / Vente / Location Votre agence immobilière à Saint-Perdon
| Prix moyen | 161 945 € | Prix moyen au m² | 1 718 € |
| Prix moyen | 92 867 € | Prix moyen au m² | 1 880 € |
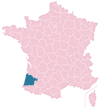
Carte de la ville de Saint-Perdon

Commerce |
|
|---|---|
|
Hypermarché (6km) Saint-Pierre-du-Mont |
|
|
Supermarché (6km) Saint-Pierre-du-Mont |
|
| Boulangerie | 1 |
|
Boucherie (6km) Saint-Pierre-du-Mont |
|
|
Station-service (6km) Saint-Pierre-du-Mont |
|
|
Banque (6km) Saint-Pierre-du-Mont |
|
|
La poste (6km) Saint-Pierre-du-Mont |
|
| Coiffeur | 1 |
|
Vétérinaire (6km) Saint-Pierre-du-Mont |
|
| Restaurant | 1 |
Santé |
|
|---|---|
|
Médecin (4km) Campagne |
|
|
Dentiste (6km) Saint-Pierre-du-Mont |
|
|
Pharmacie (6km) Saint-Pierre-du-Mont |
|
Éducation |
|
|---|---|
| Maternelle | 1 |
| Primaire | 1 |
|
Collège (6km) Saint-Pierre-du-Mont |
|
|
Lycée (6km) Saint-Pierre-du-Mont |
|


NOUVEAU : Décharges sauvages, détritus, objets abandonnés, graffitis, nids-de-poule : Déclarer un incident à Saint-Perdon


 Emmanuel MACRON
 Marine LE PEN
 Jean-Luc MÉLENCHON
 Jean LASSALLE
 Éric ZEMMOUR
 Fabien ROUSSEL
 Valérie PÉCRESSE
 Anne HIDALGO
 Yannick JADOT
 Nicolas DUPONT-AIGNAN
 Nathalie ARTHAUD
 Philippe POUTOUEmmanuel MACRONMarine LE PEN
| Ville | Habitants | Superficie | Pop densité | Pop active | Taux chômage | Revenu moyen | Prix immobilier | Note globale |
|---|---|---|---|---|---|---|---|---|
| Statistiques Campagne | 989 | 34 km² | 29 h/km² | 50.2% | 4.3% | 22 580 €/an | 1 362 €/m² | - |
| Statistiques Haut-Mauco | 983 | 19 km² | 52 h/km² | 48.6% | 3% | 24 980 €/an | 1 660 €/m² | 3.7 |
| Statistiques Saint-Pierre-du-Mont | 9 871 | 26 km² | 380 h/km² | 46.4% | 5.5% | 23 200 €/an | 1 840 €/m² | 3.9 |
| Statistiques Campet-et-Lamolère | 531 | 19 km² | 28 h/km² | 54% | 6% | 23 740 €/an | 1 635 €/m² | - |
| Statistiques Aurice | 629 | 17 km² | 37 h/km² | 47.7% | 2.9% | 23 960 €/an | 1 703 €/m² | - |
| Statistiques Uchacq-et-Parentis | 606 | 39 km² | 16 h/km² | 48.3% | 2.1% | 25 390 €/an | 1 795 €/m² | 4.0 |
| Statistiques Saint-Martin-d'Oney | 1 366 | 34 km² | 40 h/km² | 48.4% | 4.4% | 22 660 €/an | 1 776 €/m² | 4.4 |
| Statistiques Mont-de-Marsan | 30 674 | 37 km² | 829 h/km² | 43.8% | 6.3% | 22 030 €/an | 1 784 €/m² | 3.1 |
| Statistiques Le Leuy | 228 | 9 km² | 25 h/km² | 49.1% | 1.8% | 22 150 €/an | 971 €/m² | - |
| Statistiques Benquet | 1 906 | 29 km² | 66 h/km² | 47.7% | 3.5% | 25 260 €/an | 2 042 €/m² | - |
| Statistiques Bas-Mauco | 388 | 12 km² | 32 h/km² | 43.6% | 2.3% | 23 600 €/an | 1 571 €/m² | - |
| Statistiques Meilhan | 1 176 | 39 km² | 30 h/km² | 44.6% | 4.8% | 23 250 €/an | 1 495 €/m² | - |
| Statistiques Lamothe | 302 | 13 km² | 23 h/km² | 47% | 4.3% | 21 830 €/an | 1 486 €/m² | - |
| Statistiques Cauna | 430 | 13 km² | 33 h/km² | 48.4% | 5.1% | 22 860 €/an | 1 855 €/m² | - |
| Statistiques Bretagne-de-Marsan | 1 635 | 13 km² | 126 h/km² | 43.9% | 3.4% | 24 740 €/an | 1 910 €/m² | 2.9 |