


Signalement de photo
Merci ! Votre signalement est envoyé !
Quel est le nombre d'habitants à Saint-Jouvent ? Dans quel département et dans quelle région se situe la ville ? Quelle est sa superficie ?
Quels sont les chiffres de la délinquance ?
Découvrez sur cette page toutes les informations essentielles sur la population, la sécurité, les services et l'immobilier à Saint-Jouvent.
NOUVEAU : Rues sales, dépôts sauvages, dégradations urbaines. Faites votre signalement anonyme, nous nous chargeons de prévenir les autorités compétentes.
| Nombre d'habitants | 1 659 | Classement |
| Age moyen | 41 ans | Classement |
| Pop active | 49.5% | Classement |
| Taux chômage | 3% | Classement |
| Pop densité | 66 h/km² | Classement |
| Revenu moyen | 24 230 €/an | Classement |
| Agressions physiques / sexuelles | 0 |
| Cambriolages | 0 |
| Vols / dégradations | 0 |
| Stupéfiants | 0 |
Achat / Vente / Location Votre agence immobilière à Saint-Jouvent
| Prix moyen | 105 778 € | Prix moyen au m² | 1 152 € |
| Prix moyen | 27 015 € | Prix moyen au m² | 1 460 € |
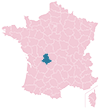
Carte de la ville de Saint-Jouvent


NOUVEAU : Décharges sauvages, détritus, objets abandonnés, graffitis, nids-de-poule : Déclarer un incident à Saint-Jouvent


 Marine LE PEN
 Emmanuel MACRON
 Jean-Luc MÉLENCHON
 Éric ZEMMOUR
 Jean LASSALLE
 Yannick JADOT
 Fabien ROUSSEL
 Valérie PÉCRESSE
 Anne HIDALGO
 Nicolas DUPONT-AIGNAN
 Philippe POUTOU
 Nathalie ARTHAUDEmmanuel MACRONMarine LE PEN
| Ville | Habitants | Superficie | Pop densité | Pop active | Taux chômage | Revenu moyen | Prix immobilier | Note globale |
|---|---|---|---|---|---|---|---|---|
| Statistiques Nieul | 1 612 | 17 km² | 95 h/km² | 46.4% | 4.2% | 24 920 €/an | 1 402 €/m² | - |
| Statistiques Peyrilhac | 1 331 | 39 km² | 34 h/km² | 48.4% | 2.4% | 22 740 €/an | 1 096 €/m² | - |
| Statistiques Thouron | 563 | 14 km² | 40 h/km² | 48.8% | 4.1% | 22 100 €/an | 1 148 €/m² | - |
| Statistiques Saint-Gence | 2 213 | 22 km² | 101 h/km² | 50.2% | 3.8% | 24 730 €/an | 1 497 €/m² | 4.8 |
| Statistiques Bonnac-la-Côte | 1 649 | 26 km² | 63 h/km² | 51% | 4.1% | 24 560 €/an | 1 654 €/m² | - |
| Statistiques Nantiat | 1 594 | 25 km² | 64 h/km² | 42.1% | 2.8% | 20 990 €/an | 974 €/m² | - |
| Statistiques Compreignac | 1 875 | 48 km² | 39 h/km² | 47.5% | 4% | 23 350 €/an | 1 293 €/m² | 5.0 |
| Statistiques Chamboret | 796 | 22 km² | 36 h/km² | 47.2% | 4.4% | 20 960 €/an | 1 019 €/m² | - |
| Statistiques Chaptelat | 2 095 | 18 km² | 116 h/km² | 48.6% | 2.5% | 25 310 €/an | 1 736 €/m² | 3.6 |
| Statistiques Veyrac | 2 139 | 34 km² | 63 h/km² | 50.7% | 3.4% | 24 700 €/an | 1 306 €/m² | 3.0 |
| Statistiques Le Buis | 184 | 7 km² | 26 h/km² | 50.5% | 1.6% | 21 990 €/an | 1 203 €/m² | - |
| Statistiques Couzeix | 9 828 | 31 km² | 317 h/km² | 41.8% | 3.1% | 24 820 €/an | 1 694 €/m² | 3.9 |
| Statistiques Rilhac-Rancon | 4 694 | 17 km² | 276 h/km² | 44.4% | 2.7% | 25 000 €/an | 1 712 €/m² | 2.6 |
| Statistiques Vaulry | 402 | 16 km² | 25 h/km² | 50.7% | 3.2% | 19 470 €/an | 1 070 €/m² | - |
| Statistiques Limoges | 129 760 | 78 km² | 1 664 h/km² | 43.6% | 7.5% | 20 590 €/an | 1 454 €/m² | 3.6 |