


Signalement de photo
Merci ! Votre signalement est envoyé !
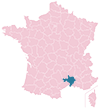
Quel est le nombre d'habitants à Saint-Gervasy ? Dans quel département et dans quelle région se situe la ville ? Quelle est sa superficie ?
Quels sont les chiffres de la délinquance ?
Découvrez sur cette page toutes les informations essentielles sur la population, la sécurité, les services et l'immobilier à Saint-Gervasy.
NOUVEAU : Rues sales, dépôts sauvages, dégradations urbaines. Faites votre signalement anonyme, nous nous chargeons de prévenir les autorités compétentes.
| Nombre d'habitants | 1 994 | Classement |
| Age moyen | 40 ans | Classement |
| Pop active | 47.6% | Classement |
| Taux chômage | 6.2% | Classement |
| Pop densité | 285 h/km² | Classement |
| Revenu moyen | 21 910 €/an | Classement |
| Agressions physiques / sexuelles | 0 |
| Cambriolages | 6 |
| Vols / dégradations | 18 |
| Stupéfiants | 0 |
Achat / Vente / Location Votre agence immobilière à Saint-Gervasy
| Prix moyen | 215 692 € | Prix moyen au m² | 2 282 € |
| Prix moyen | 134 325 € | Prix moyen au m² | 2 217 € |
Carte de la ville de Saint-Gervasy

Commerce |
|
|---|---|
|
Hypermarché (12km) Nîmes |
|
|
Supermarché (5km) Marguerittes |
|
| Boulangerie | 1 |
|
Boucherie (0km) Bezouce |
|
|
Station-service (5km) Marguerittes |
|
|
Banque (5km) Marguerittes |
|
|
La poste (0km) Bezouce |
|
| Coiffeur | 3 |
|
Vétérinaire (5km) Marguerittes |
|
| Restaurant | 8 |
Santé |
|
|---|---|
| Médecin | 1 |
| Dentiste | 2 |
| Pharmacie | 1 |
Éducation |
|
|---|---|
| Maternelle | 1 |
| Primaire | 1 |
|
Collège (5km) Marguerittes |
|
|
Lycée (7km) Meynes |
|


NOUVEAU : Décharges sauvages, détritus, objets abandonnés, graffitis, nids-de-poule : Déclarer un incident à Saint-Gervasy


 Marine LE PEN
 Emmanuel MACRON
 Jean-Luc MÉLENCHON
 Éric ZEMMOUR
 Jean LASSALLE
 Yannick JADOT
 Nicolas DUPONT-AIGNAN
 Valérie PÉCRESSE
 Anne HIDALGO
 Fabien ROUSSEL
 Philippe POUTOU
 Nathalie ARTHAUDEmmanuel MACRONMarine LE PEN
| Ville | Habitants | Superficie | Pop densité | Pop active | Taux chômage | Revenu moyen | Prix immobilier | Note globale |
|---|---|---|---|---|---|---|---|---|
| Statistiques Bezouce | 2 328 | 12 km² | 194 h/km² | 46.6% | 4.8% | 22 380 €/an | 2 119 €/m² | 4.5 |
| Statistiques Cabrières | 1 746 | 15 km² | 116 h/km² | 47.7% | 5.8% | 24 450 €/an | 2 202 €/m² | 4.1 |
| Statistiques Marguerittes | 8 467 | 25 km² | 339 h/km² | 43.7% | 5.1% | 22 560 €/an | 2 349 €/m² | 3.4 |
| Statistiques Lédenon | 1 658 | 19 km² | 87 h/km² | 49.5% | 5.3% | 22 530 €/an | 2 162 €/m² | 2.8 |
| Statistiques Redessan | 4 181 | 16 km² | 261 h/km² | 46.9% | 5.5% | 22 090 €/an | 2 764 €/m² | 2.6 |
| Statistiques Poulx | 4 237 | 12 km² | 353 h/km² | 47.4% | 4.9% | 27 500 €/an | 2 428 €/m² | 4.5 |
| Statistiques Sernhac | 1 794 | 9 km² | 199 h/km² | 48.4% | 5.4% | 22 530 €/an | 1 877 €/m² | - |
| Statistiques Meynes | 2 572 | 17 km² | 151 h/km² | 45.1% | 6.6% | 22 900 €/an | 2 025 €/m² | 3.8 |
| Statistiques Rodilhan | 2 821 | 5 km² | 564 h/km² | 43.5% | 5.1% | 23 140 €/an | 2 260 €/m² | - |
| Statistiques Collias | 1 064 | 20 km² | 53 h/km² | 45.7% | 7.6% | 22 440 €/an | 2 535 €/m² | - |
| Statistiques Manduel | 7 109 | 26 km² | 273 h/km² | 45.6% | 6.2% | 22 520 €/an | 2 139 €/m² | 3.3 |
| Statistiques Saint-Bonnet-du-Gard | 833 | 7 km² | 119 h/km² | 50.2% | 8.5% | 23 660 €/an | 2 300 €/m² | 1.2 |
| Statistiques Remoulins | 2 260 | 8 km² | 283 h/km² | 45.5% | 8.7% | 19 700 €/an | 1 902 €/m² | 3.5 |
| Statistiques Jonquières-Saint-Vincent | 3 851 | 21 km² | 183 h/km² | 43.3% | 5.9% | 21 460 €/an | 2 132 €/m² | 3.2 |
| Statistiques Sanilhac-Sagriès | 813 | 22 km² | 37 h/km² | 41.8% | 4.4% | 22 350 €/an | 3 012 €/m² | - |