


Signalement de photo
Merci ! Votre signalement est envoyé !
Quel est le nombre d'habitants à Saint-Chamas ? Dans quel département et dans quelle région se situe la ville ? Quelle est sa superficie ?
Quels sont les chiffres de la délinquance ?
Découvrez sur cette page toutes les informations essentielles sur la population, la sécurité, les services et l'immobilier à Saint-Chamas.
NOUVEAU : Rues sales, dépôts sauvages, dégradations urbaines. Faites votre signalement anonyme, nous nous chargeons de prévenir les autorités compétentes.
| Nombre d'habitants | 8 643 | Classement |
| Age moyen | 42 ans | Classement |
| Pop active | 48.8% | Classement |
| Taux chômage | 4.7% | Classement |
| Pop densité | 320 h/km² | Classement |
| Revenu moyen | 24 610 €/an | Classement |
| Agressions physiques / sexuelles | 86 |
| Cambriolages | 29 |
| Vols / dégradations | 128 |
| Stupéfiants | 50 |
Achat / Vente / Location Votre agence immobilière à Saint-Chamas
| Prix moyen | 287 547 € | Prix moyen au m² | 3 265 € |
| Prix moyen | 138 557 € | Prix moyen au m² | 2 526 € |
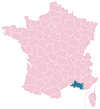
Carte de la ville de Saint-Chamas

Commerce |
|
|---|---|
|
Hypermarché (5km) Miramas |
|
| Supermarché | 1 |
| Boulangerie | 6 |
| Boucherie | 4 |
|
Station-service (5km) Miramas |
|
| Banque | 4 |
| La poste | 1 |
| Coiffeur | 11 |
| Vétérinaire | 2 |
| Restaurant | 22 |
Santé |
|
|---|---|
| Médecin | 16 |
| Dentiste | 3 |
| Pharmacie | 2 |
Éducation |
|
|---|---|
| Maternelle | 3 |
| Primaire | 2 |
| Collège | 1 |
| Lycée | 1 |


NOUVEAU : Décharges sauvages, détritus, objets abandonnés, graffitis, nids-de-poule : Déclarer un incident à Saint-Chamas


 Marine LE PEN
 Jean-Luc MÉLENCHON
 Emmanuel MACRON
 Éric ZEMMOUR
 Yannick JADOT
 Jean LASSALLE
 Nicolas DUPONT-AIGNAN
 Valérie PÉCRESSE
 Fabien ROUSSEL
 Anne HIDALGO
 Philippe POUTOU
 Nathalie ARTHAUDEmmanuel MACRONMarine LE PEN
| Ville | Habitants | Superficie | Pop densité | Pop active | Taux chômage | Revenu moyen | Prix immobilier | Note globale |
|---|---|---|---|---|---|---|---|---|
| Statistiques Cornillon-Confoux | 1 571 | 15 km² | 105 h/km² | 45.4% | 4.1% | 29 130 €/an | 3 425 €/m² | 4.4 |
| Statistiques Miramas | 26 405 | 26 km² | 1 016 h/km² | 42.3% | 6.2% | 19 810 €/an | 2 507 €/m² | 3.2 |
| Statistiques Istres | 44 577 | 114 km² | 391 h/km² | 47.1% | 5.5% | 22 710 €/an | 2 623 €/m² | 3.3 |
| Statistiques Grans | 5 274 | 28 km² | 188 h/km² | 48.3% | 4.6% | 26 790 €/an | 2 917 €/m² | 4.0 |
| Statistiques Lançon-Provence | 9 340 | 69 km² | 135 h/km² | 49.3% | 4.7% | 26 720 €/an | 3 263 €/m² | 3.3 |
| Statistiques Salon-de-Provence | 44 731 | 70 km² | 639 h/km² | 46.9% | 6.4% | 22 400 €/an | 2 627 €/m² | 3.6 |
| Statistiques Saint-Mitre-les-Remparts | 5 816 | 21 km² | 277 h/km² | 45.3% | 5.2% | 26 910 €/an | 3 264 €/m² | 3.0 |
| Statistiques La Fare-les-Oliviers | 8 867 | 14 km² | 633 h/km² | 49.7% | 4.9% | 26 620 €/an | 3 293 €/m² | 2.5 |
| Statistiques Pélissanne | 10 554 | 19 km² | 555 h/km² | 46.2% | 4% | 27 170 €/an | 3 254 €/m² | 3.6 |
| Statistiques Fos-sur-Mer | 15 469 | 92 km² | 168 h/km² | 47.7% | 6.1% | 23 680 €/an | 2 968 €/m² | 3.0 |
| Statistiques La Barben | 850 | 23 km² | 37 h/km² | 53.8% | 3.9% | 30 140 €/an | 2 776 €/m² | - |
| Statistiques Berre-l'Étang | 13 912 | 44 km² | 316 h/km² | 44.8% | 7.3% | 20 370 €/an | 2 446 €/m² | 3.7 |
| Statistiques Aurons | 564 | 13 km² | 43 h/km² | 43.1% | 5.7% | 30 160 €/an | 3 017 €/m² | - |
| Statistiques Eyguières | 6 887 | 69 km² | 100 h/km² | 48.3% | 4.8% | 25 680 €/an | 3 313 €/m² | 3.8 |
| Statistiques Martigues | 48 568 | 71 km² | 684 h/km² | 44% | 6.4% | 22 570 €/an | 3 087 €/m² | 3.2 |