


Signalement de photo
Merci ! Votre signalement est envoyé !
Quel est le nombre d'habitants à Saclay ? Dans quel département et dans quelle région se situe la ville ? Quelle est sa superficie ?
Quels sont les chiffres de la délinquance ?
Découvrez sur cette page toutes les informations essentielles sur la population, la sécurité, les services et l'immobilier à Saclay.
NOUVEAU : Rues sales, dépôts sauvages, dégradations urbaines. Faites votre signalement anonyme, nous nous chargeons de prévenir les autorités compétentes.
| Nombre d'habitants | 4 323 | Classement |
| Age moyen | 37 ans | Classement |
| Pop active | 49.3% | Classement |
| Taux chômage | 2.5% | Classement |
| Pop densité | 309 h/km² | Classement |
| Revenu moyen | 34 070 €/an | Classement |
| Agressions physiques / sexuelles | 15 |
| Cambriolages | 0 |
| Vols / dégradations | 98 |
| Stupéfiants | 0 |
Achat / Vente / Location Votre agence immobilière à Saclay
| Prix moyen | 543 200 € | Prix moyen au m² | 4 856 € |
| Prix moyen | 296 994 € | Prix moyen au m² | 4 917 € |
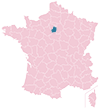
Carte de la ville de Saclay

Commerce |
|
|---|---|
|
Hypermarché (6km) Les Ulis |
|
| Supermarché | 1 |
| Boulangerie | 2 |
|
Boucherie (4km) Igny |
|
| Station-service | 3 |
| Banque | 2 |
|
La poste (4km) Igny |
|
| Coiffeur | 3 |
|
Vétérinaire (4km) Igny |
|
| Restaurant | 8 |
Santé |
|
|---|---|
| Médecin | 16 |
| Dentiste | 2 |
| Pharmacie | 3 |


NOUVEAU : Décharges sauvages, détritus, objets abandonnés, graffitis, nids-de-poule : Déclarer un incident à Saclay


 Emmanuel MACRON
 Jean-Luc MÉLENCHON
 Marine LE PEN
 Valérie PÉCRESSE
 Éric ZEMMOUR
 Yannick JADOT
 Nicolas DUPONT-AIGNAN
 Fabien ROUSSEL
 Jean LASSALLE
 Anne HIDALGO
 Nathalie ARTHAUD
 Philippe POUTOUEmmanuel MACRONMarine LE PEN
| Ville | Habitants | Superficie | Pop densité | Pop active | Taux chômage | Revenu moyen | Prix immobilier | Note globale |
|---|---|---|---|---|---|---|---|---|
| Statistiques Vauhallan | 2 066 | 3 km² | 689 h/km² | 44.4% | 3.4% | 37 410 €/an | 4 952 €/m² | 4.1 |
| Statistiques Saint-Aubin | 681 | 4 km² | 170 h/km² | 50.5% | 3.8% | 39 060 €/an | 3 239 €/m² | - |
| Statistiques Igny | 10 213 | 4 km² | 2 553 h/km² | 49.3% | 3.6% | 31 760 €/an | 4 445 €/m² | 4.0 |
| Statistiques Bures-sur-Yvette | 9 254 | 4 km² | 2 314 h/km² | 46.5% | 3% | 33 510 €/an | 4 175 €/m² | 4.2 |
| Statistiques Jouy-en-Josas | 7 928 | 10 km² | 793 h/km² | 41.3% | 3.7% | 35 740 €/an | 4 751 €/m² | 3.3 |
| Statistiques Orsay | 16 007 | 8 km² | 2 001 h/km² | 46.7% | 3.6% | 33 200 €/an | 4 319 €/m² | 4.0 |
| Statistiques Les Loges-en-Josas | 1 646 | 2 km² | 823 h/km² | 45.4% | 3.5% | 40 940 €/an | 5 401 €/m² | 5.0 |
| Statistiques Villiers-le-Bâcle | 1 097 | 6 km² | 183 h/km² | 53% | 2.3% | 34 170 €/an | 3 844 €/m² | - |
| Statistiques Bièvres | 4 748 | 10 km² | 475 h/km² | 52.6% | 3.4% | 34 800 €/an | 4 649 €/m² | 4.3 |
| Statistiques Toussus-le-Noble | 1 157 | 4 km² | 289 h/km² | 52.3% | 3.5% | 35 870 €/an | 3 642 €/m² | 3.2 |
| Statistiques Buc | 5 920 | 8 km² | 740 h/km² | 50.2% | 3% | 35 400 €/an | 4 874 €/m² | 4.2 |
| Statistiques Châteaufort | 1 515 | 5 km² | 303 h/km² | 49.6% | 3.4% | 37 760 €/an | 4 124 €/m² | 4.3 |
| Statistiques Les Ulis | 25 253 | 5 km² | 5 051 h/km² | 46.8% | 7.2% | 19 950 €/an | 2 291 €/m² | 3.3 |
| Statistiques Gif-sur-Yvette | 22 352 | 12 km² | 1 863 h/km² | 42.9% | 3.4% | 34 730 €/an | 3 906 €/m² | 3.8 |
| Statistiques Gometz-le-Châtel | 2 615 | 5 km² | 523 h/km² | 49.6% | 3.1% | 30 690 €/an | 3 586 €/m² | 4.1 |