


Signalement de photo
Merci ! Votre signalement est envoyé !
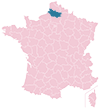
Quel est le nombre d'habitants à Roye ? Dans quel département et dans quelle région se situe la ville ? Quelle est sa superficie ?
Quels sont les chiffres de la délinquance ?
Découvrez sur cette page toutes les informations essentielles sur la population, la sécurité, les services et l'immobilier à Roye.
NOUVEAU : Rues sales, dépôts sauvages, dégradations urbaines. Faites votre signalement anonyme, nous nous chargeons de prévenir les autorités compétentes.
| Nombre d'habitants | 5 662 | Classement |
| Age moyen | 43 ans | Classement |
| Pop active | 43.6% | Classement |
| Taux chômage | 9.1% | Classement |
| Pop densité | 354 h/km² | Classement |
| Revenu moyen | 18 970 €/an | Classement |
| Agressions physiques / sexuelles | 170 |
| Cambriolages | 14 |
| Vols / dégradations | 166 |
| Stupéfiants | 113 |
Achat / Vente / Location Votre agence immobilière à Roye
| Prix moyen | 112 652 € | Prix moyen au m² | 1 246 € |
| Prix moyen | 52 202 € | Prix moyen au m² | 1 202 € |
Carte de la ville de Roye

Commerce |
|
|---|---|
| Hypermarché | 1 |
| Supermarché | 5 |
| Boulangerie | 4 |
| Boucherie | 3 |
| Station-service | 3 |
| Banque | 9 |
| La poste | 1 |
| Coiffeur | 16 |
| Vétérinaire | 2 |
| Restaurant | 29 |
Santé |
|
|---|---|
| Médecin | 32 |
| Dentiste | 1 |
| Pharmacie | 4 |
Éducation |
|
|---|---|
| Maternelle | 3 |
| Primaire | 3 |
| Collège | 2 |
|
Lycée (15km) Orvillers-Sorel |
|


NOUVEAU : Décharges sauvages, détritus, objets abandonnés, graffitis, nids-de-poule : Déclarer un incident à Roye


 Marine LE PEN
 Emmanuel MACRON
 Jean-Luc MÉLENCHON
 Éric ZEMMOUR
 Fabien ROUSSEL
 Valérie PÉCRESSE
 Jean LASSALLE
 Nicolas DUPONT-AIGNAN
 Yannick JADOT
 Anne HIDALGO
 Philippe POUTOU
 Nathalie ARTHAUDEmmanuel MACRONMarine LE PEN
| Ville | Habitants | Superficie | Pop densité | Pop active | Taux chômage | Revenu moyen | Prix immobilier | Note globale |
|---|---|---|---|---|---|---|---|---|
| Statistiques Carrépuis | 265 | 6 km² | 44 h/km² | 53.6% | 6% | 23 240 €/an | 1 141 €/m² | - |
| Statistiques Goyencourt | 95 | 5 km² | 19 h/km² | 49.5% | 3.2% | NC | 881 €/m² | - |
| Statistiques Roiglise | 152 | 6 km² | 25 h/km² | 47.4% | 4.6% | 22 620 €/an | 1 052 €/m² | - |
| Statistiques Saint-Mard | 156 | 4 km² | 39 h/km² | 44.2% | 5.8% | 24 270 €/an | 1 304 €/m² | - |
| Statistiques Fresnoy-lès-Roye | 285 | 8 km² | 36 h/km² | 42.1% | 4.2% | 22 900 €/an | 856 €/m² | - |
| Statistiques Verpillières | 167 | 5 km² | 33 h/km² | 49.7% | 6% | 22 750 €/an | 1 028 €/m² | - |
| Statistiques Champien | 286 | 9 km² | 32 h/km² | 48.3% | 4.2% | 23 230 €/an | 1 348 €/m² | - |
| Statistiques Gruny | 307 | 7 km² | 44 h/km² | 53.7% | 7.5% | 22 870 €/an | 1 048 €/m² | - |
| Statistiques Laucourt | 187 | 6 km² | 31 h/km² | 50.8% | 5.3% | 20 630 €/an | 1 188 €/m² | - |
| Statistiques Villers-lès-Roye | 275 | 6 km² | 46 h/km² | 44% | 2.9% | 23 170 €/an | 1 212 €/m² | - |
| Statistiques Balâtre | 72 | 3 km² | 24 h/km² | 44.4% | 5.6% | NC | 1 328 €/m² | - |
| Statistiques Biarre | 61 | 2 km² | 31 h/km² | 44.3% | 1.6% | NC | NC | - |
| Statistiques Margny-aux-Cerises | 254 | 5 km² | 51 h/km² | 46.1% | 9.4% | 23 220 €/an | 1 300 €/m² | - |
| Statistiques Damery | 228 | 5 km² | 46 h/km² | 53.5% | 4.4% | 21 170 €/an | 1 192 €/m² | - |
| Statistiques Liancourt-Fosse | 292 | 6 km² | 49 h/km² | 47.9% | 4.5% | 21 780 €/an | 958 €/m² | 1.4 |