


Signalement de photo
Merci ! Votre signalement est envoyé !
Quel est le nombre d'habitants à Pouydraguin ? Dans quel département et dans quelle région se situe la ville ? Quelle est sa superficie ?
Quels sont les chiffres de la délinquance ?
Découvrez sur cette page toutes les informations essentielles sur la population, la sécurité, les services et l'immobilier à Pouydraguin.
NOUVEAU : Rues sales, dépôts sauvages, dégradations urbaines. Faites votre signalement anonyme, nous nous chargeons de prévenir les autorités compétentes.
| Nombre d'habitants | 126 | Classement |
| Age moyen | 46 ans | Classement |
| Pop active | 45.2% | Classement |
| Taux chômage | 5.6% | Classement |
| Pop densité | 13 h/km² | Classement |
| Revenu moyen | 22 390 €/an | Classement |
| Agressions physiques / sexuelles | 0 |
| Cambriolages | 0 |
| Vols / dégradations | 0 |
| Stupéfiants | 0 |
Achat / Vente / Location Votre agence immobilière à Pouydraguin
| Prix moyen | 195 504 € | Prix moyen au m² | 1 116 € |
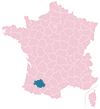
Carte de la ville de Pouydraguin

Commerce |
|
|---|---|
|
Hypermarché (20km) Maubourguet |
|
|
Supermarché (6km) Plaisance |
|
|
Boulangerie (6km) Plaisance |
|
|
Boucherie (6km) Plaisance |
|
|
Station-service (6km) Plaisance |
|
|
Banque (6km) Plaisance |
|
|
La poste (6km) Plaisance |
|
| Coiffeur | 1 |
|
Vétérinaire (6km) Plaisance |
|
|
Restaurant (5km) Cahuzac-sur-Adour |
|


NOUVEAU : Décharges sauvages, détritus, objets abandonnés, graffitis, nids-de-poule : Déclarer un incident à Pouydraguin


 Jean-Luc MÉLENCHON
 Emmanuel MACRON
 Marine LE PEN
 Valérie PÉCRESSE
 Jean LASSALLE
 Fabien ROUSSEL
 Yannick JADOT
 Nicolas DUPONT-AIGNAN
 Éric ZEMMOUR
 Anne HIDALGO
 Philippe POUTOU
 Nathalie ARTHAUDEmmanuel MACRONMarine LE PEN
| Ville | Habitants | Superficie | Pop densité | Pop active | Taux chômage | Revenu moyen | Prix immobilier | Note globale |
|---|---|---|---|---|---|---|---|---|
| Statistiques Tasque | 245 | 10 km² | 25 h/km² | 42.4% | 6.1% | 19 350 €/an | 1 090 €/m² | - |
| Statistiques Loussous-Débat | 70 | 5 km² | 14 h/km² | 34.3% | 4.3% | NC | NC | - |
| Statistiques Lasserade | 184 | 13 km² | 14 h/km² | 40.8% | 5.4% | 21 750 €/an | 1 457 €/m² | - |
| Statistiques Fustérouau | 135 | 8 km² | 17 h/km² | 51.1% | 4.4% | 19 170 €/an | 597 €/m² | - |
| Statistiques Galiax | 183 | 6 km² | 31 h/km² | 43.2% | 4.9% | 19 580 €/an | 1 402 €/m² | - |
| Statistiques Izotges | 88 | 3 km² | 29 h/km² | 44.3% | 9.1% | NC | 654 €/m² | - |
| Statistiques Termes-d'Armagnac | 190 | 10 km² | 19 h/km² | 37.9% | 2.6% | 18 970 €/an | 680 €/m² | - |
| Statistiques Cahuzac-sur-Adour | 202 | 7 km² | 29 h/km² | 54% | 3% | 19 800 €/an | 1 031 €/m² | - |
| Statistiques Couloumé-Mondebat | 200 | 23 km² | 9 h/km² | 36.5% | 9% | 19 560 €/an | 1 460 €/m² | - |
| Statistiques Bétous | 72 | 5 km² | 14 h/km² | 47.2% | 2.8% | NC | 500 €/m² | - |
| Statistiques Bouzon-Gellenave | 163 | 10 km² | 16 h/km² | 42.9% | 6.1% | 22 810 €/an | 1 269 €/m² | - |
| Statistiques Sabazan | 131 | 8 km² | 16 h/km² | 51.9% | 3.8% | 21 280 €/an | 920 €/m² | - |
| Statistiques Plaisance | 1 421 | 14 km² | 102 h/km² | 35% | 5% | 20 700 €/an | 950 €/m² | - |
| Statistiques Préchac-sur-Adour | 192 | 4 km² | 48 h/km² | 41.1% | 5.7% | 19 660 €/an | 1 562 €/m² | 2.2 |
| Statistiques Goux | 62 | 5 km² | 12 h/km² | 33.9% | 1.6% | NC | 1 462 €/m² | - |