


Signalement de photo
Merci ! Votre signalement est envoyé !
Quel est le nombre d'habitants à Pouilly ? Dans quel département et dans quelle région se situe la ville ? Quelle est sa superficie ?
Quels sont les chiffres de la délinquance ?
Découvrez sur cette page toutes les informations essentielles sur la population, la sécurité, les services et l'immobilier à Pouilly.
NOUVEAU : Rues sales, dépôts sauvages, dégradations urbaines. Faites votre signalement anonyme, nous nous chargeons de prévenir les autorités compétentes.
| Nombre d'habitants | 827 | Classement |
| Age moyen | 44 ans | Classement |
| Pop active | 40.3% | Classement |
| Taux chômage | 1.6% | Classement |
| Pop densité | 165 h/km² | Classement |
| Revenu moyen | 27 220 €/an | Classement |
| Agressions physiques / sexuelles | 0 |
| Cambriolages | 0 |
| Vols / dégradations | 0 |
| Stupéfiants | 0 |
Achat / Vente / Location Votre agence immobilière à Pouilly
| Prix moyen | 0 € | Prix moyen au m² | 0 € |
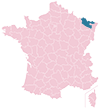
Carte de la ville de Pouilly


NOUVEAU : Décharges sauvages, détritus, objets abandonnés, graffitis, nids-de-poule : Déclarer un incident à Pouilly


 Emmanuel MACRON
 Marine LE PEN
 Jean-Luc MÉLENCHON
 Éric ZEMMOUR
 Yannick JADOT
 Valérie PÉCRESSE
 Jean LASSALLE
 Anne HIDALGO
 Nicolas DUPONT-AIGNAN
 Fabien ROUSSEL
 Nathalie ARTHAUD
 Philippe POUTOUEmmanuel MACRONMarine LE PEN
| Ville | Habitants | Superficie | Pop densité | Pop active | Taux chômage | Revenu moyen | Prix immobilier | Note globale |
|---|---|---|---|---|---|---|---|---|
| Statistiques Cuvry | 987 | 5 km² | 197 h/km² | 43.2% | 1.8% | 29 170 €/an | NC | 4.0 |
| Statistiques Fleury | 1 286 | 10 km² | 129 h/km² | 49.4% | 2.3% | 28 930 €/an | NC | - |
| Statistiques Marly | 9 971 | 11 km² | 906 h/km² | 42.3% | 3.8% | 27 920 €/an | NC | 4.2 |
| Statistiques Coin-lès-Cuvry | 811 | 7 km² | 116 h/km² | 50.1% | 3.9% | 29 150 €/an | NC | 3.2 |
| Statistiques Verny | 2 005 | 4 km² | 501 h/km² | 50.7% | 3.9% | 26 380 €/an | NC | 4.0 |
| Statistiques Pournoy-la-Chétive | 619 | 3 km² | 206 h/km² | 47.7% | 3.4% | 27 920 €/an | NC | - |
| Statistiques Pournoy-la-Grasse | 717 | 7 km² | 102 h/km² | 51.7% | 1.4% | 31 100 €/an | NC | - |
| Statistiques Chesny | 565 | 4 km² | 141 h/km² | 52.4% | 2.8% | 28 610 €/an | NC | 4.0 |
| Statistiques Peltre | 1 821 | 8 km² | 228 h/km² | 42.3% | 3.3% | 29 680 €/an | NC | 3.6 |
| Statistiques Chérisey | 280 | 5 km² | 56 h/km² | 48.6% | 2.5% | 28 260 €/an | NC | - |
| Statistiques Augny | 2 136 | 15 km² | 142 h/km² | 50.5% | 3.6% | 28 100 €/an | NC | 4.3 |
| Statistiques Jury | 1 338 | 3 km² | 446 h/km² | 46.8% | 2.8% | 27 620 €/an | NC | - |
| Statistiques Coin-sur-Seille | 333 | 3 km² | 111 h/km² | 45.6% | 1.5% | 29 650 €/an | NC | 2.0 |
| Statistiques Pommerieux | 718 | 4 km² | 180 h/km² | 51.4% | 2.1% | 27 990 €/an | NC | - |
| Statistiques Montigny-lès-Metz | 21 854 | 7 km² | 3 122 h/km² | 46.7% | 6.5% | 21 930 €/an | NC | 3.6 |