


Signalement de photo
Merci ! Votre signalement est envoyé !
Quel est le nombre d'habitants à Le Porge ? Dans quel département et dans quelle région se situe la ville ? Quelle est sa superficie ?
Quels sont les chiffres de la délinquance ?
Découvrez sur cette page toutes les informations essentielles sur la population, la sécurité, les services et l'immobilier à Le Porge.
NOUVEAU : Rues sales, dépôts sauvages, dégradations urbaines. Faites votre signalement anonyme, nous nous chargeons de prévenir les autorités compétentes.
| Nombre d'habitants | 3 371 | Classement |
| Age moyen | 40 ans | Classement |
| Pop active | 48.3% | Classement |
| Taux chômage | 5% | Classement |
| Pop densité | 23 h/km² | Classement |
| Revenu moyen | 24 540 €/an | Classement |
| Agressions physiques / sexuelles | 21 |
| Cambriolages | 0 |
| Vols / dégradations | 43 |
| Stupéfiants | 26 |
Achat / Vente / Location Votre agence immobilière à Le Porge
| Prix moyen | 288 802 € | Prix moyen au m² | 2 885 € |
| Prix moyen | 147 014 € | Prix moyen au m² | 2 136 € |
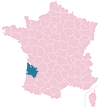
Carte de la ville de Le Porge

Commerce |
|
|---|---|
|
Hypermarché (12km) Arès |
|
| Supermarché | 1 |
| Boulangerie | 3 |
| Boucherie | 1 |
| Station-service | 1 |
|
Banque (12km) Arès |
|
| La poste | 1 |
| Coiffeur | 8 |
| Vétérinaire | 1 |
| Restaurant | 18 |
Santé |
|
|---|---|
| Médecin | 2 |
| Dentiste | 3 |
| Pharmacie | 1 |
Éducation |
|
|---|---|
| Maternelle | 1 |
| Primaire | 1 |
|
Collège (13km) Lacanau |
|
|
Lycée (14km) Andernos-les-Bains |
|


NOUVEAU : Décharges sauvages, détritus, objets abandonnés, graffitis, nids-de-poule : Déclarer un incident à Le Porge


 Marine LE PEN
 Emmanuel MACRON
 Jean-Luc MÉLENCHON
 Éric ZEMMOUR
 Jean LASSALLE
 Fabien ROUSSEL
 Yannick JADOT
 Valérie PÉCRESSE
 Nicolas DUPONT-AIGNAN
 Anne HIDALGO
 Philippe POUTOU
 Nathalie ARTHAUDEmmanuel MACRONMarine LE PEN
| Ville | Habitants | Superficie | Pop densité | Pop active | Taux chômage | Revenu moyen | Prix immobilier | Note globale |
|---|---|---|---|---|---|---|---|---|
| Statistiques Le Temple | 644 | 72 km² | 9 h/km² | 50.5% | 3.4% | 26 430 €/an | 2 210 €/m² | - |
| Statistiques Saumos | 548 | 58 km² | 9 h/km² | 48% | 3.8% | 23 890 €/an | 2 653 €/m² | - |
| Statistiques Arès | 6 441 | 48 km² | 134 h/km² | 38.3% | 4.3% | 25 530 €/an | 3 999 €/m² | 3.5 |
| Statistiques Lacanau | 5 031 | 214 km² | 24 h/km² | 43.6% | 6% | 25 500 €/an | 3 914 €/m² | 3.0 |
| Statistiques Andernos-les-Bains | 12 472 | 20 km² | 624 h/km² | 37.5% | 4.4% | 27 410 €/an | 4 507 €/m² | 3.6 |
| Statistiques Lanton | 7 276 | 136 km² | 54 h/km² | 41.3% | 4.9% | 25 910 €/an | 4 015 €/m² | 3.5 |
| Statistiques Sainte-Hélène | 3 004 | 128 km² | 23 h/km² | 50.5% | 4.5% | 25 300 €/an | 2 546 €/m² | 4.8 |
| Statistiques Salaunes | 1 227 | 43 km² | 29 h/km² | 51.7% | 3.9% | 26 640 €/an | 3 172 €/m² | 4.6 |
| Statistiques Audenge | 9 371 | 82 km² | 114 h/km² | 46.5% | 5.3% | 24 210 €/an | 3 094 €/m² | 3.4 |
| Statistiques Arcachon | 11 259 | 8 km² | 1 407 h/km² | 27.7% | 4.5% | 27 150 €/an | 6 421 €/m² | 3.6 |
| Statistiques Brach | 849 | 29 km² | 29 h/km² | 52.8% | 3.4% | 24 550 €/an | 2 330 €/m² | - |
| Statistiques Carcans | 2 418 | 175 km² | 14 h/km² | 44.3% | 5% | 23 810 €/an | 3 206 €/m² | 3.0 |
| Statistiques Saint-Jean-d'Illac | 9 304 | 121 km² | 77 h/km² | 52.4% | 3.9% | 27 540 €/an | 3 570 €/m² | 3.8 |
| Statistiques Biganos | 11 095 | 53 km² | 209 h/km² | 48.1% | 5.4% | 24 400 €/an | 3 134 €/m² | 3.6 |
| Statistiques Martignas-sur-Jalle | 7 850 | 26 km² | 302 h/km² | 50.9% | 3% | 27 750 €/an | 3 484 €/m² | 3.9 |