


Signalement de photo
Merci ! Votre signalement est envoyé !
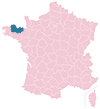
Quel est le nombre d'habitants à Ploumilliau ? Dans quel département et dans quelle région se situe la ville ? Quelle est sa superficie ?
Quels sont les chiffres de la délinquance ?
Découvrez sur cette page toutes les informations essentielles sur la population, la sécurité, les services et l'immobilier à Ploumilliau.
NOUVEAU : Rues sales, dépôts sauvages, dégradations urbaines. Faites votre signalement anonyme, nous nous chargeons de prévenir les autorités compétentes.
| Nombre d'habitants | 2 453 | Classement |
| Age moyen | 47 ans | Classement |
| Pop active | 39.1% | Classement |
| Taux chômage | 4.6% | Classement |
| Pop densité | 70 h/km² | Classement |
| Revenu moyen | 22 440 €/an | Classement |
| Agressions physiques / sexuelles | 0 |
| Cambriolages | 0 |
| Vols / dégradations | 10 |
| Stupéfiants | 0 |
Achat / Vente / Location Votre agence immobilière à Ploumilliau
| Prix moyen | 121 326 € | Prix moyen au m² | 1 221 € |
| Prix moyen | 62 500 € | Prix moyen au m² | 1 289 € |
Carte de la ville de Ploumilliau

Commerce |
|
|---|---|
|
Hypermarché (7km) Lannion |
|
|
Supermarché (5km) Ploubezre |
|
| Boulangerie | 2 |
| Boucherie | 1 |
|
Station-service (5km) Ploubezre |
|
| Banque | 1 |
| La poste | 1 |
| Coiffeur | 3 |
|
Vétérinaire (7km) Lannion |
|
| Restaurant | 4 |
Santé |
|
|---|---|
| Médecin | 2 |
| Dentiste | 1 |
| Pharmacie | 1 |


NOUVEAU : Décharges sauvages, détritus, objets abandonnés, graffitis, nids-de-poule : Déclarer un incident à Ploumilliau


 Emmanuel MACRON
 Marine LE PEN
 Jean-Luc MÉLENCHON
 Fabien ROUSSEL
 Yannick JADOT
 Jean LASSALLE
 Valérie PÉCRESSE
 Éric ZEMMOUR
 Anne HIDALGO
 Nicolas DUPONT-AIGNAN
 Philippe POUTOU
 Nathalie ARTHAUDEmmanuel MACRONMarine LE PEN
| Ville | Habitants | Superficie | Pop densité | Pop active | Taux chômage | Revenu moyen | Prix immobilier | Note globale |
|---|---|---|---|---|---|---|---|---|
| Statistiques Saint-Michel-en-Grève | 448 | 5 km² | 90 h/km² | 41.3% | 7.4% | 23 640 €/an | 2 320 €/m² | 2.9 |
| Statistiques Plouzélambre | 214 | 8 km² | 27 h/km² | 51.9% | 7% | 20 230 €/an | 898 €/m² | - |
| Statistiques Trédrez-Locquémeau | 1 456 | 11 km² | 132 h/km² | 39.5% | 5.2% | 24 280 €/an | 2 035 €/m² | 3.6 |
| Statistiques Tréduder | 192 | 5 km² | 38 h/km² | 44.3% | 5.2% | 21 460 €/an | 1 378 €/m² | - |
| Statistiques Ploubezre | 3 743 | 31 km² | 121 h/km² | 43.8% | 4.3% | 23 310 €/an | 1 584 €/m² | 3.7 |
| Statistiques Lannion | 20 344 | 44 km² | 462 h/km² | 42.8% | 6.8% | 23 220 €/an | 1 543 €/m² | 3.6 |
| Statistiques Lanvellec | 595 | 19 km² | 31 h/km² | 38.2% | 4.9% | 21 830 €/an | 1 310 €/m² | - |
| Statistiques Plouaret | 2 206 | 30 km² | 74 h/km² | 38% | 5% | 21 840 €/an | 1 321 €/m² | 3.5 |
| Statistiques Tonquédec | 1 201 | 18 km² | 67 h/km² | 46.8% | 4.9% | 22 200 €/an | 1 112 €/m² | - |
| Statistiques Pleumeur-Bodou | 3 809 | 27 km² | 141 h/km² | 39.8% | 4.5% | 25 900 €/an | 2 275 €/m² | 4.2 |
| Statistiques Plestin-les-Grèves | 3 635 | 35 km² | 104 h/km² | 32.5% | 4.4% | 23 310 €/an | 1 509 €/m² | 2.9 |
| Statistiques Locquirec | 1 528 | 6 km² | 255 h/km² | 33.9% | 4.7% | 25 730 €/an | 2 649 €/m² | 3.4 |
| Statistiques Plufur | 533 | 18 km² | 30 h/km² | 43.3% | 3.8% | 20 540 €/an | 1 411 €/m² | - |
| Statistiques Trébeurden | 3 761 | 13 km² | 289 h/km² | 36.2% | 3.6% | 26 120 €/an | 2 194 €/m² | 3.2 |
| Statistiques Rospez | 1 787 | 13 km² | 137 h/km² | 43.4% | 5.1% | 22 940 €/an | 1 337 €/m² | 3.6 |