


Signalement de photo
Merci ! Votre signalement est envoyé !
Quel est le nombre d'habitants à Périgneux ? Dans quel département et dans quelle région se situe la ville ? Quelle est sa superficie ?
Quels sont les chiffres de la délinquance ?
Découvrez sur cette page toutes les informations essentielles sur la population, la sécurité, les services et l'immobilier à Périgneux.
NOUVEAU : Rues sales, dépôts sauvages, dégradations urbaines. Faites votre signalement anonyme, nous nous chargeons de prévenir les autorités compétentes.
| Nombre d'habitants | 1 605 | Classement |
| Age moyen | 39 ans | Classement |
| Pop active | 50.7% | Classement |
| Taux chômage | 3.4% | Classement |
| Pop densité | 50 h/km² | Classement |
| Revenu moyen | 24 340 €/an | Classement |
| Agressions physiques / sexuelles | 0 |
| Cambriolages | 0 |
| Vols / dégradations | 0 |
| Stupéfiants | 0 |
Achat / Vente / Location Votre agence immobilière à Périgneux
| Prix moyen | 146 506 € | Prix moyen au m² | 1 538 € |
| Prix moyen | 30 433 € | Prix moyen au m² | 553 € |
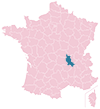
Carte de la ville de Périgneux

Commerce |
|
|---|---|
|
Hypermarché (12km) Firminy |
|
|
Supermarché (7km) La Tourette |
|
| Boulangerie | 1 |
|
Boucherie (4km) Saint-Maurice-en-Gourgois |
|
|
Station-service (6km) Saint-Marcellin-en-Forez |
|
|
Banque (6km) Saint-Marcellin-en-Forez |
|
|
La poste (6km) Saint-Marcellin-en-Forez |
|
| Coiffeur | 1 |
|
Vétérinaire (7km) La Tourette |
|
| Restaurant | 2 |
Santé |
|
|---|---|
|
Médecin (4km) Saint-Maurice-en-Gourgois |
|
|
Dentiste (6km) Saint-Marcellin-en-Forez |
|
|
Pharmacie (6km) Saint-Marcellin-en-Forez |
|
Éducation |
|
|---|---|
| Maternelle | 1 |
| Primaire | 1 |
|
Collège (8km) Aurec-sur-Loire |
|
|
Lycée (11km) Sury-le-Comtal |
|


NOUVEAU : Décharges sauvages, détritus, objets abandonnés, graffitis, nids-de-poule : Déclarer un incident à Périgneux


 Marine LE PEN
 Emmanuel MACRON
 Jean-Luc MÉLENCHON
 Éric ZEMMOUR
 Yannick JADOT
 Valérie PÉCRESSE
 Jean LASSALLE
 Nicolas DUPONT-AIGNAN
 Fabien ROUSSEL
 Anne HIDALGO
 Philippe POUTOU
 Nathalie ARTHAUDEmmanuel MACRONMarine LE PEN
| Ville | Habitants | Superficie | Pop densité | Pop active | Taux chômage | Revenu moyen | Prix immobilier | Note globale |
|---|---|---|---|---|---|---|---|---|
| Statistiques Aboën | 473 | 9 km² | 53 h/km² | 46.5% | 2.1% | 23 450 €/an | 1 281 €/m² | - |
| Statistiques Saint-Maurice-en-Gourgois | 1 822 | 32 km² | 57 h/km² | 49.2% | 3.3% | 24 080 €/an | 1 397 €/m² | 3.6 |
| Statistiques Caloire | 314 | 5 km² | 63 h/km² | 53.2% | 4.5% | 29 190 €/an | 2 477 €/m² | - |
| Statistiques Chambles | 1 068 | 19 km² | 56 h/km² | 48.2% | 2.3% | 27 140 €/an | 2 131 €/m² | - |
| Statistiques Saint-Marcellin-en-Forez | 5 060 | 31 km² | 163 h/km² | 47% | 3.7% | 23 780 €/an | 2 005 €/m² | 3.3 |
| Statistiques Saint-Paul-en-Cornillon | 1 345 | 4 km² | 336 h/km² | 45.1% | 3.3% | 27 970 €/an | 1 869 €/m² | - |
| Statistiques La Tourette | 627 | 6 km² | 105 h/km² | 48% | 3.7% | 24 260 €/an | 1 574 €/m² | 3.6 |
| Statistiques Saint-Nizier-de-Fornas | 656 | 16 km² | 41 h/km² | 47.1% | 2.3% | 24 360 €/an | 1 623 €/m² | - |
| Statistiques Aurec-sur-Loire | 6 171 | 22 km² | 281 h/km² | 43.4% | 4.2% | 23 200 €/an | 1 681 €/m² | 4.3 |
| Statistiques Saint-Bonnet-le-Château | 1 477 | 2 km² | 739 h/km² | 39.1% | 4.9% | 19 930 €/an | 1 343 €/m² | 4.0 |
| Statistiques Luriecq | 1 268 | 20 km² | 63 h/km² | 51.3% | 4.1% | 23 100 €/an | 1 666 €/m² | - |
| Statistiques Rozier-Côtes-d'Aurec | 426 | 14 km² | 30 h/km² | 45.8% | 4.7% | 22 560 €/an | 1 215 €/m² | 3.2 |
| Statistiques Chenereilles | 513 | 9 km² | 57 h/km² | 51.5% | 3.3% | 24 550 €/an | 1 307 €/m² | - |
| Statistiques Unieux | 8 479 | 9 km² | 942 h/km² | 43.8% | 5.4% | 22 060 €/an | 1 717 €/m² | 3.1 |
| Statistiques Fraisses | 3 779 | 5 km² | 756 h/km² | 44.5% | 4.8% | 23 530 €/an | 1 626 €/m² | 4.3 |