


Signalement de photo
Merci ! Votre signalement est envoyé !
Quel est le nombre d'habitants à Péault ? Dans quel département et dans quelle région se situe la ville ? Quelle est sa superficie ?
Quels sont les chiffres de la délinquance ?
Découvrez sur cette page toutes les informations essentielles sur la population, la sécurité, les services et l'immobilier à Péault.
NOUVEAU : Rues sales, dépôts sauvages, dégradations urbaines. Faites votre signalement anonyme, nous nous chargeons de prévenir les autorités compétentes.
| Nombre d'habitants | 611 | Classement |
| Age moyen | 40 ans | Classement |
| Pop active | 46.8% | Classement |
| Taux chômage | 4.3% | Classement |
| Pop densité | 68 h/km² | Classement |
| Revenu moyen | 22 760 €/an | Classement |
| Agressions physiques / sexuelles | 0 |
| Cambriolages | 0 |
| Vols / dégradations | 0 |
| Stupéfiants | 0 |
Achat / Vente / Location Votre agence immobilière à Péault
| Prix moyen | 157 681 € | Prix moyen au m² | 1 502 € |
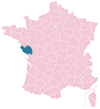
Carte de la ville de Péault

Commerce |
|
|---|---|
|
Hypermarché (7km) Luçon |
|
|
Supermarché (7km) Luçon |
|
|
Boulangerie (2km) Les Magnils-Reigniers |
|
|
Boucherie (3km) Corpe |
|
|
Station-service (7km) Luçon |
|
|
Banque (7km) Luçon |
|
|
La poste (7km) Luçon |
|
|
Coiffeur (2km) Les Magnils-Reigniers |
|
|
Vétérinaire (7km) Luçon |
|
| Restaurant | 1 |


NOUVEAU : Décharges sauvages, détritus, objets abandonnés, graffitis, nids-de-poule : Déclarer un incident à Péault


 Marine LE PEN
 Emmanuel MACRON
 Jean-Luc MÉLENCHON
 Éric ZEMMOUR
 Jean LASSALLE
 Valérie PÉCRESSE
 Yannick JADOT
 Fabien ROUSSEL
 Nicolas DUPONT-AIGNAN
 Anne HIDALGO
 Philippe POUTOU
 Nathalie ARTHAUDEmmanuel MACRONMarine LE PEN
| Ville | Habitants | Superficie | Pop densité | Pop active | Taux chômage | Revenu moyen | Prix immobilier | Note globale |
|---|---|---|---|---|---|---|---|---|
| Statistiques Les Magnils-Reigniers | 1 471 | 18 km² | 82 h/km² | 47% | 5% | 22 490 €/an | 1 343 €/m² | - |
| Statistiques Corpe | 1 010 | 17 km² | 59 h/km² | 51.6% | 5.3% | 22 590 €/an | 1 271 €/m² | - |
| Statistiques La Bretonnière-la-Claye | 582 | 16 km² | 36 h/km² | 47.8% | 3.8% | 22 370 €/an | 1 297 €/m² | - |
| Statistiques Chasnais | 767 | 11 km² | 70 h/km² | 50.5% | 4.4% | 23 960 €/an | 1 623 €/m² | - |
| Statistiques La Couture | 227 | 7 km² | 32 h/km² | 37% | 4.4% | 20 760 €/an | 2 670 €/m² | - |
| Statistiques Lairoux | 608 | 13 km² | 47 h/km² | 44.1% | 3% | 22 640 €/an | 1 413 €/m² | - |
| Statistiques Bessay | 438 | 11 km² | 40 h/km² | 41.8% | 2.7% | 22 130 €/an | 1 514 €/m² | 2.8 |
| Statistiques Luçon | 9 483 | 32 km² | 296 h/km² | 39.6% | 7.4% | 21 510 €/an | 1 459 €/m² | 3.9 |
| Statistiques Rosnay | 660 | 14 km² | 47 h/km² | 46.1% | 4.1% | 20 540 €/an | 1 165 €/m² | - |
| Statistiques Moutiers-sur-le-Lay | 803 | 18 km² | 45 h/km² | 44.1% | 4% | 21 940 €/an | 1 162 €/m² | - |
| Statistiques Curzon | 507 | 6 km² | 85 h/km² | 46.4% | 6.1% | 19 900 €/an | 1 002 €/m² | 2.0 |
| Statistiques Sainte-Gemme-la-Plaine | 2 063 | 36 km² | 57 h/km² | 48.3% | 3.9% | 22 960 €/an | 1 597 €/m² | 3.3 |
| Statistiques Château-Guibert | 1 515 | 35 km² | 43 h/km² | 45.5% | 4.1% | 22 780 €/an | 1 271 €/m² | - |
| Statistiques Sainte-Pexine | 291 | 16 km² | 18 h/km² | 51.9% | 7.6% | 20 960 €/an | 1 268 €/m² | - |
| Statistiques Saint-Denis-du-Payré | 391 | 16 km² | 24 h/km² | 37.3% | 5.9% | 22 100 €/an | 1 219 €/m² | 2.2 |