


Signalement de photo
Merci ! Votre signalement est envoyé !
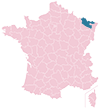
Quel est le nombre d'habitants à Oeting ? Dans quel département et dans quelle région se situe la ville ? Quelle est sa superficie ?
Quels sont les chiffres de la délinquance ?
Découvrez sur cette page toutes les informations essentielles sur la population, la sécurité, les services et l'immobilier à Oeting.
NOUVEAU : Rues sales, dépôts sauvages, dégradations urbaines. Faites votre signalement anonyme, nous nous chargeons de prévenir les autorités compétentes.
| Nombre d'habitants | 2 674 | Classement |
| Age moyen | 43 ans | Classement |
| Pop active | 51.2% | Classement |
| Taux chômage | 4.5% | Classement |
| Pop densité | 669 h/km² | Classement |
| Revenu moyen | 26 690 €/an | Classement |
| Agressions physiques / sexuelles | 0 |
| Cambriolages | 0 |
| Vols / dégradations | 19 |
| Stupéfiants | 0 |
Achat / Vente / Location Votre agence immobilière à Oeting
| Prix moyen | 0 € | Prix moyen au m² | 0 € |
Carte de la ville de Oeting


NOUVEAU : Décharges sauvages, détritus, objets abandonnés, graffitis, nids-de-poule : Déclarer un incident à Oeting


 Marine LE PEN
 Emmanuel MACRON
 Jean-Luc MÉLENCHON
 Éric ZEMMOUR
 Valérie PÉCRESSE
 Yannick JADOT
 Nicolas DUPONT-AIGNAN
 Jean LASSALLE
 Fabien ROUSSEL
 Anne HIDALGO
 Nathalie ARTHAUD
 Philippe POUTOUEmmanuel MACRONMarine LE PEN
| Ville | Habitants | Superficie | Pop densité | Pop active | Taux chômage | Revenu moyen | Prix immobilier | Note globale |
|---|---|---|---|---|---|---|---|---|
| Statistiques Forbach | 21 130 | 16 km² | 1 321 h/km² | 39.3% | 10% | 17 540 €/an | NC | 2.3 |
| Statistiques Folkling | 1 374 | 12 km² | 115 h/km² | 45.3% | 4.1% | 25 070 €/an | NC | - |
| Statistiques Behren-lès-Forbach | 6 433 | 6 km² | 1 072 h/km² | 36.4% | 11.3% | 15 770 €/an | NC | 3.2 |
| Statistiques Morsbach | 2 666 | 5 km² | 533 h/km² | 45.4% | 4.7% | 20 940 €/an | NC | 3.6 |
| Statistiques Bousbach | 1 208 | 6 km² | 201 h/km² | 50.6% | 3.6% | 25 050 €/an | NC | - |
| Statistiques Stiring-Wendel | 11 067 | 4 km² | 2 767 h/km² | 40.6% | 8.6% | 18 700 €/an | NC | 3.2 |
| Statistiques Théding | 2 441 | 8 km² | 305 h/km² | 42.8% | 8.4% | 20 320 €/an | NC | - |
| Statistiques Kerbach | 1 215 | 4 km² | 304 h/km² | 45.7% | 3.3% | 26 230 €/an | NC | - |
| Statistiques Etzling | 1 147 | 5 km² | 229 h/km² | 45.8% | 2.5% | 26 230 €/an | NC | - |
| Statistiques Rosbruck | 739 | 1 km² | 739 h/km² | 42.6% | 6.6% | 21 400 €/an | NC | - |
| Statistiques Cocheren | 3 359 | 6 km² | 560 h/km² | 41.2% | 7% | 20 980 €/an | NC | 3.0 |
| Statistiques Spicheren | 3 218 | 8 km² | 402 h/km² | 49.2% | 4.5% | 25 950 €/an | NC | 3.9 |
| Statistiques Alsting | 2 499 | 6 km² | 417 h/km² | 49.7% | 3.2% | 25 770 €/an | NC | - |
| Statistiques Schoeneck | 2 450 | 4 km² | 613 h/km² | 49.7% | 5.1% | 24 080 €/an | NC | - |
| Statistiques Tenteling | 1 046 | 7 km² | 149 h/km² | 49.2% | 5.4% | 25 280 €/an | NC | - |