


Signalement de photo
Merci ! Votre signalement est envoyé !
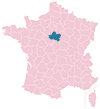
Quel est le nombre d'habitants à Nevoy ? Dans quel département et dans quelle région se situe la ville ? Quelle est sa superficie ?
Quels sont les chiffres de la délinquance ?
Découvrez sur cette page toutes les informations essentielles sur la population, la sécurité, les services et l'immobilier à Nevoy.
NOUVEAU : Rues sales, dépôts sauvages, dégradations urbaines. Faites votre signalement anonyme, nous nous chargeons de prévenir les autorités compétentes.
| Nombre d'habitants | 1 156 | Classement |
| Age moyen | 44 ans | Classement |
| Pop active | 47.7% | Classement |
| Taux chômage | 4.5% | Classement |
| Pop densité | 37 h/km² | Classement |
| Revenu moyen | 25 840 €/an | Classement |
| Agressions physiques / sexuelles | 0 |
| Cambriolages | 0 |
| Vols / dégradations | 0 |
| Stupéfiants | 0 |
Achat / Vente / Location Votre agence immobilière à Nevoy
| Prix moyen | 119 704 € | Prix moyen au m² | 1 006 € |
| Prix moyen | 41 500 € | Prix moyen au m² | 838 € |
Carte de la ville de Nevoy

Commerce |
|
|---|---|
|
Hypermarché (4km) Gien |
|
|
Supermarché (4km) Poilly-lez-Gien |
|
| Boulangerie | 1 |
|
Boucherie (4km) Poilly-lez-Gien |
|
|
Station-service (4km) Poilly-lez-Gien |
|
|
Banque (4km) Gien |
|
|
La poste (4km) Gien |
|
| Coiffeur | 2 |
|
Vétérinaire (4km) Gien |
|
|
Restaurant (4km) Poilly-lez-Gien |
|
Santé |
|
|---|---|
| Médecin | 1 |
|
Dentiste (4km) Gien |
|
|
Pharmacie (4km) Poilly-lez-Gien |
|
Éducation |
|
|---|---|
| Maternelle | 1 |
| Primaire | 1 |
|
Collège (4km) Poilly-lez-Gien |
|
|
Lycée (4km) Gien |
|


NOUVEAU : Décharges sauvages, détritus, objets abandonnés, graffitis, nids-de-poule : Déclarer un incident à Nevoy


 Emmanuel MACRON
 Marine LE PEN
 Jean-Luc MÉLENCHON
 Éric ZEMMOUR
 Valérie PÉCRESSE
 Fabien ROUSSEL
 Nicolas DUPONT-AIGNAN
 Jean LASSALLE
 Yannick JADOT
 Anne HIDALGO
 Nathalie ARTHAUD
 Philippe POUTOUEmmanuel MACRONMarine LE PEN
| Ville | Habitants | Superficie | Pop densité | Pop active | Taux chômage | Revenu moyen | Prix immobilier | Note globale |
|---|---|---|---|---|---|---|---|---|
| Statistiques Poilly-lez-Gien | 2 441 | 33 km² | 74 h/km² | 42.3% | 2.9% | 24 110 €/an | 1 148 €/m² | 3.2 |
| Statistiques Saint-Gondon | 1 063 | 22 km² | 48 h/km² | 48.2% | 4.4% | 24 310 €/an | 1 338 €/m² | - |
| Statistiques Gien | 13 387 | 68 km² | 197 h/km² | 39.9% | 6.9% | 19 830 €/an | 1 143 €/m² | 3.2 |
| Statistiques Dampierre-en-Burly | 1 431 | 47 km² | 30 h/km² | 51.2% | 3.5% | 24 770 €/an | 1 391 €/m² | 1.8 |
| Statistiques Lion-en-Sullias | 387 | 24 km² | 16 h/km² | 52.5% | 4.7% | 22 590 €/an | 3 116 €/m² | - |
| Statistiques Saint-Florent | 448 | 38 km² | 12 h/km² | 40.8% | 4.5% | 22 290 €/an | 1 418 €/m² | - |
| Statistiques Ouzouer-sur-Loire | 2 572 | 34 km² | 76 h/km² | 48.4% | 3.6% | 25 180 €/an | 1 419 €/m² | 3.8 |
| Statistiques Saint-Martin-sur-Ocre | 1 227 | 16 km² | 77 h/km² | 47.4% | 3.9% | 25 210 €/an | 1 296 €/m² | - |
| Statistiques Guidel | 11 947 | 52 km² | 230 h/km² | 43.6% | 4.5% | 26 610 €/an | 2 645 €/m² | 3.5 |
| Statistiques Saint-Brisson-sur-Loire | 961 | 22 km² | 44 h/km² | 44% | 4% | 23 730 €/an | 1 116 €/m² | - |
| Statistiques Les Choux | 530 | 33 km² | 16 h/km² | 49.6% | 4.9% | 23 820 €/an | 1 300 €/m² | - |
| Statistiques Saint-Aignan-le-Jaillard | 608 | 24 km² | 25 h/km² | 41.3% | 5.6% | 21 670 €/an | 1 528 €/m² | - |
| Statistiques Boismorand | 847 | 25 km² | 34 h/km² | 44% | 2.7% | 25 380 €/an | 1 097 €/m² | 3.8 |
| Statistiques Plouhinec | 5 354 | 36 km² | 149 h/km² | 40.5% | 3.5% | 24 450 €/an | 2 453 €/m² | 3.5 |
| Statistiques Langesse | 82 | 9 km² | 9 h/km² | 41.5% | 3.7% | NC | 807 €/m² | - |