


Signalement de photo
Merci ! Votre signalement est envoyé !
Quel est le nombre d'habitants à Nalliers ? Dans quel département et dans quelle région se situe la ville ? Quelle est sa superficie ?
Quels sont les chiffres de la délinquance ?
Découvrez sur cette page toutes les informations essentielles sur la population, la sécurité, les services et l'immobilier à Nalliers.
NOUVEAU : Rues sales, dépôts sauvages, dégradations urbaines. Faites votre signalement anonyme, nous nous chargeons de prévenir les autorités compétentes.
| Nombre d'habitants | 2 353 | Classement |
| Age moyen | 44 ans | Classement |
| Pop active | 43.6% | Classement |
| Taux chômage | 4.2% | Classement |
| Pop densité | 69 h/km² | Classement |
| Revenu moyen | 21 660 €/an | Classement |
| Agressions physiques / sexuelles | 5 |
| Cambriolages | 0 |
| Vols / dégradations | 10 |
| Stupéfiants | 0 |
Achat / Vente / Location Votre agence immobilière à Nalliers
| Prix moyen | 124 968 € | Prix moyen au m² | 1 194 € |
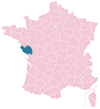
Carte de la ville de Nalliers

Commerce |
|
|---|---|
|
Hypermarché (10km) Luçon |
|
|
Supermarché (9km) Sainte-Hermine |
|
| Boulangerie | 1 |
| Boucherie | 2 |
|
Station-service (5km) Sainte-Gemme-la-Plaine |
|
| Banque | 3 |
| La poste | 1 |
| Coiffeur | 3 |
|
Vétérinaire (5km) Sainte-Gemme-la-Plaine |
|
| Restaurant | 1 |
Santé |
|
|---|---|
| Médecin | 4 |
|
Dentiste (5km) Sainte-Gemme-la-Plaine |
|
| Pharmacie | 1 |
Éducation |
|
|---|---|
| Maternelle | 2 |
| Primaire | 2 |
|
Collège (9km) Sainte-Hermine |
|
|
Lycée (5km) Sainte-Gemme-la-Plaine |
|


NOUVEAU : Décharges sauvages, détritus, objets abandonnés, graffitis, nids-de-poule : Déclarer un incident à Nalliers


 Marine LE PEN
 Emmanuel MACRON
 Jean-Luc MÉLENCHON
 Éric ZEMMOUR
 Jean LASSALLE
 Yannick JADOT
 Valérie PÉCRESSE
 Anne HIDALGO
 Fabien ROUSSEL
 Nicolas DUPONT-AIGNAN
 Nathalie ARTHAUD
 Philippe POUTOUEmmanuel MACRONMarine LE PEN
| Ville | Habitants | Superficie | Pop densité | Pop active | Taux chômage | Revenu moyen | Prix immobilier | Note globale |
|---|---|---|---|---|---|---|---|---|
| Statistiques Mouzeuil-Saint-Martin | 1 188 | 26 km² | 46 h/km² | 45.5% | 4.8% | 21 230 €/an | 1 429 €/m² | - |
| Statistiques Sainte-Gemme-la-Plaine | 2 063 | 36 km² | 57 h/km² | 48.3% | 3.9% | 22 960 €/an | 1 597 €/m² | 3.3 |
| Statistiques Saint-Aubin-la-Plaine | 538 | 12 km² | 45 h/km² | 50.4% | 8.2% | 21 140 €/an | 1 215 €/m² | - |
| Statistiques Saint-Étienne-de-Brillouet | 623 | 19 km² | 33 h/km² | 52.3% | 4.3% | 21 840 €/an | 1 209 €/m² | - |
| Statistiques Saint-Jean-de-Beugné | 622 | 13 km² | 48 h/km² | 47.4% | 2.3% | 22 640 €/an | 1 382 €/m² | - |
| Statistiques Moreilles | 409 | 20 km² | 20 h/km² | 46.5% | 6.4% | 19 730 €/an | 1 251 €/m² | - |
| Statistiques Le Langon | 1 031 | 24 km² | 43 h/km² | 44.9% | 4.6% | 20 630 €/an | 1 199 €/m² | - |
| Statistiques Pouillé | 638 | 17 km² | 38 h/km² | 45.6% | 5.2% | 20 950 €/an | 979 €/m² | - |
| Statistiques Petosse | 683 | 16 km² | 43 h/km² | 49.2% | 5% | 21 250 €/an | 1 105 €/m² | - |
| Statistiques Sainte-Hermine | 2 951 | 34 km² | 87 h/km² | 44.8% | 4.5% | 21 150 €/an | 1 090 €/m² | 3.8 |
| Statistiques Chaillé-les-Marais | 1 893 | 40 km² | 47 h/km² | 43.8% | 6% | 21 810 €/an | 1 259 €/m² | 3.4 |
| Statistiques Thiré | 537 | 12 km² | 45 h/km² | 44.7% | 4.3% | 21 570 €/an | 1 062 €/m² | 4.4 |
| Statistiques Luçon | 9 483 | 32 km² | 296 h/km² | 39.6% | 7.4% | 21 510 €/an | 1 459 €/m² | 3.9 |
| Statistiques L'Hermenault | 922 | 11 km² | 84 h/km² | 38.5% | 6.1% | 20 150 €/an | 985 €/m² | - |
| Statistiques Saint-Valérien | 541 | 14 km² | 39 h/km² | 42.1% | 4.8% | 22 330 €/an | 1 089 €/m² | - |